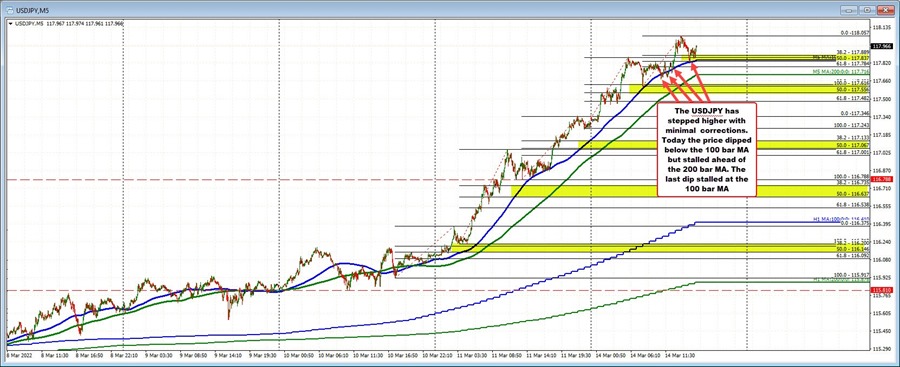
A trend move is most evident on the 5 minute chart (although it is obvious on other charts as well).
Often the look shows steps in the direction of the trend and modest corrections.
The steps - or legs - see the price start from a base, extend higher, correct toward the 38.2% -50% area, but stalls and restarts another leg in the direction of the trend.
Important is to measure the corrections of the individual legs (this is why I like to use the 5 minute chart). The 38.2 – 50% retracement area is of those individual legs and not the entire move.
The yellow areas in the chart above show the 38.2-50% of the trend legs. Note how corrections stall at or ahead of those area before moving higher.
So what are the reasons for this dynamic?
Trends are fast and directional. They also tend to go further than what traders expect. As a result the smart traders are aggressive on corrections. They buy early and against the 38.2-50% of the legs.
So when the trend started in the USDJPY after breaking above swing highs on March 10 and moving away from the 100/200 bar moving averages, on March 11, traders leaned against the 38.2% retracement of that move higher and restarted another trend move from 116.24 all the way up to 117.06. That next correction saw the price decline stall ahead of the 38.2% retracement 116.735 (the low was at 116.788). A new trend leg was started (and so on).
Traders who are on the trend, LOVE to see the 38.2-50% of the most recent trend leg hold support. That gives them clues that the trend is alive and well. There is nothing like confirmation that you are right.
The other side of the shallow corrections, is that the sellers in the USDJPY are losing, and the losses are accelerating without the ability to get out on a meaningful correction. So sellers in a trend lose money quickly. That dynamic helps to feed the trend.
The other technical clue in a trend market off the five minute chart is that the 100/200 bar moving averages provide solid support.
In the chart above, during Friday's trade, the price consolidated into the rising 100 bar moving average, found support buyers near that level and restarted the trend move to the upside.
Today, the price has dipped below the 100 bar moving average on three separate occasions, but could not extend through the 38.2 – 50% level nor reached the lower 200 bar moving average. In fact the price has not traded below the 200 bar moving average since March 10 when the trend move to the upside started.
If the sellers are to get some satisfaction, and the buyers are to lose control, getting below the 100 bar moving average and staying below, moving below the 200 bar moving average and moving below the 50% retracement of the last leg are the requirements. Absent that and the sellers are not winning. The buyers and the trend remain in tact.
Going forward it will take a move below the 100 bar MA and the 38.2-50% of the recent move higher. After that, a break of the 200 bar MA would be eyed. Absent those moves, the buyers still hold the sellers hostage. The trend is still in place.
Move below, and the waters get more muddy for the trend.


