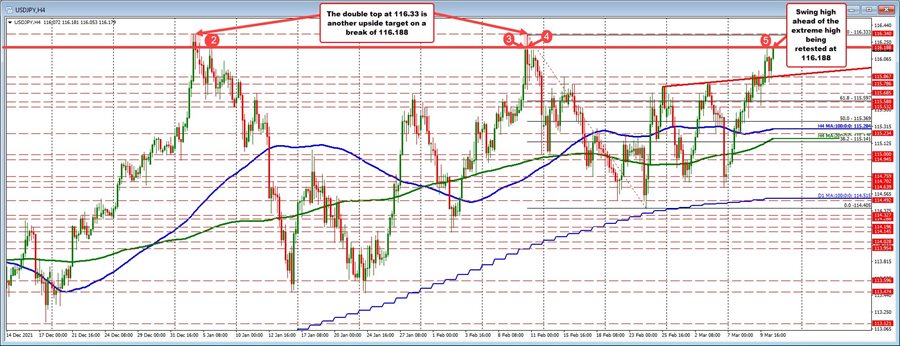
Looking at the 4-hour chart of the USDJPY above, the pair is currently retesting the high price from earlier in the day near 116.18. That is also near swing highs going back to early January and early February at the same level.
The 116.188 level is a lower high ahead of the extreme highs from 2022 which came in at 116.33 area. There is a double top at that double top from January 4 and February 10.
If the price is able to extend above 116.188, that double top at 116.33 becomes the next hurdle to get to and through.
Hold resistance here and a rotation back to the downside can be expected.
Looking at the hourly chart, the area between 115.786 and 115.867 stalled the falls today in the Asian and London morning session. That area will continue to be a support level going forward. If broken, however, the short term bearish bias would increase with traders looking toward 115.685 (swing level), 115.597 (broken 61.8% retracement), and the rising 100 hour moving average (blue line) at 115.53 as downside targets.
The 200 hour moving average (green line) is at 115.409.
On Monday and Tuesday, the price used both the 200 and 100 hour moving averages as support. The price launched off of those levels on its way to the highs reached today (see blue and green lines in the chart below).


