On the daily chart below, we can see that after the big and fast rally caused by the Silicon Valley Bank collapse and the fall in real yields, gold has entered a consolidation near the previous top.
We can also notice that the price is diverging with the MACD, which is generally a signal of a loss of momentum and we can generally see a pullback afterwards. The market started to consolidate as the data after the banking crisis has not confirmed weakness in the economy yet, on the contrary, the economic reports have been stronger than expected. It’s likely that we will see a major pullback in case the data keeps beating expectations.
XAUUSD technical analysis

On the 4 hour chart below, we can see that the recent pullback bounced from the 38.2% Fibonacci retracement level. We can also see a symmetrical triangle pattern. The price can breakout on either side, so it’s paramount to watch the economic data as an eventual breakout should lead to a big move. Tomorrow, we have the US Jobless Claims report and it’s likely that we will see weakness in gold in case the data beats and strength in case the data misses.

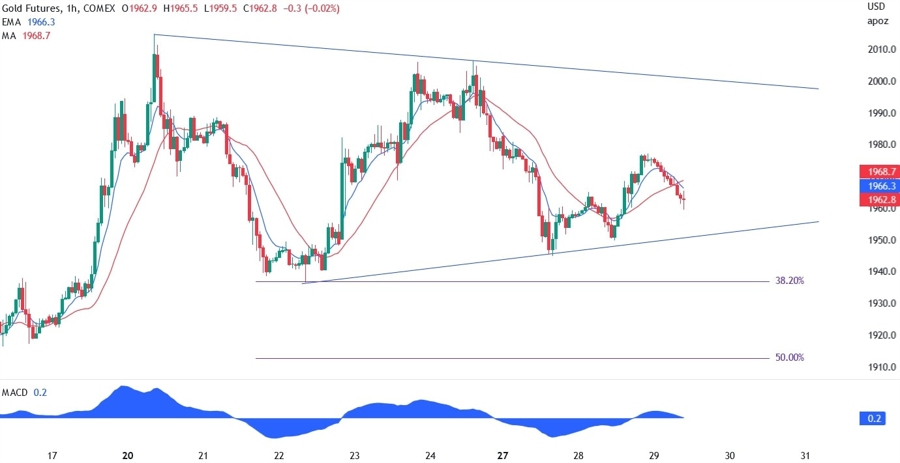
On the 1 hour chart below, we can see more closely the symmetrical triangle consolidation. Generally, it’s better to sit out and wait for the breakout caused by a fundamental catalyst before entering new positions. One can easily get chopped out in such environments.