There are a handful of ways to measure the risk trade more broadly and it's the alignment of them that often provides a clear signal on where we're heading next.
In general, the list includes:
- US equities
- AUD/JPY or EMFX
- Treasury yields
- Oil or broad commodities
There are times when certain assets can be added to that list or removed for a long list of reasons but it always gravitates back to that group.
At the moment, bitcoin is vying to be added to the group. For a time, the bitcoin evangelists argued it was more of an inflation hedge or an uncorrelated asset but that certainly hasn't been the case. Instead, it's turned into another way to track and trade broad sentiment. At times it's been the best intraday leading indicator of better sentiment out there.
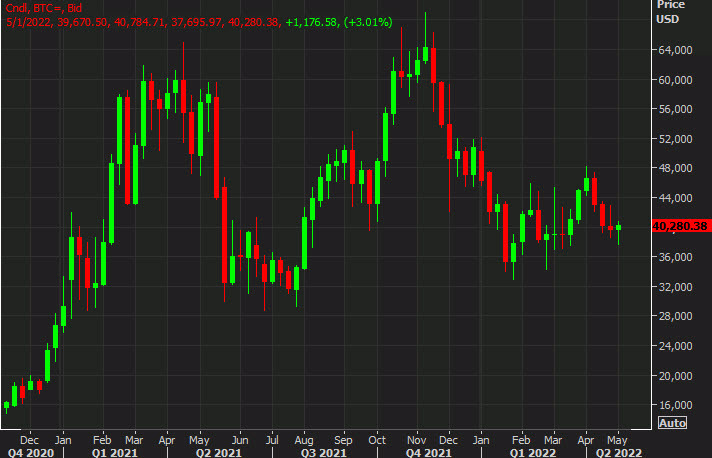
Today it was strong early but wobbled on the tech reversal but now it's making new highs, up 3.2% to $40,355. That erases the swoon on Tuesday and puts it within striking distance of the weekly high of $40,784. It's also slightly higher on the week, which is a big win in this environment.
The weekly chart, in fact, is probably the best look. It shows a non-trending trade but doesn't show any indications of a breakdown in sentiment. Including this week, there are are series of higher lows and we wait for a break into a trending trade.
On its own, that would be a neutral chart but given the pain in tech stocks, holding its ground is a good look for BTC. Seasonally, May is a strong month.