The risk from not listening to the technical price action
Ask traders what might happen given a situation, and you are likely to get bullish or bearish scenario. If the ECB does this the EURUSD should go lower. If they don't do this, the EURUSD should do this.
That is before price action (I call it technicals) come into play. You can always fit "a story" to how the price goes. Draghi said that "easing was now over" The"ECB threw out all the stops, so now there will be a recovery". "Stocks give up gains, so the risk on trade was unwound and that pushed the price higher" Then you get the ubiquitous, one size fits all "It was a short squeeze"...
Then there are the technicals and the technical price action story.
If there is any story that can be weaved, then any thing can happen to the price too. That is what we are witnessing today.
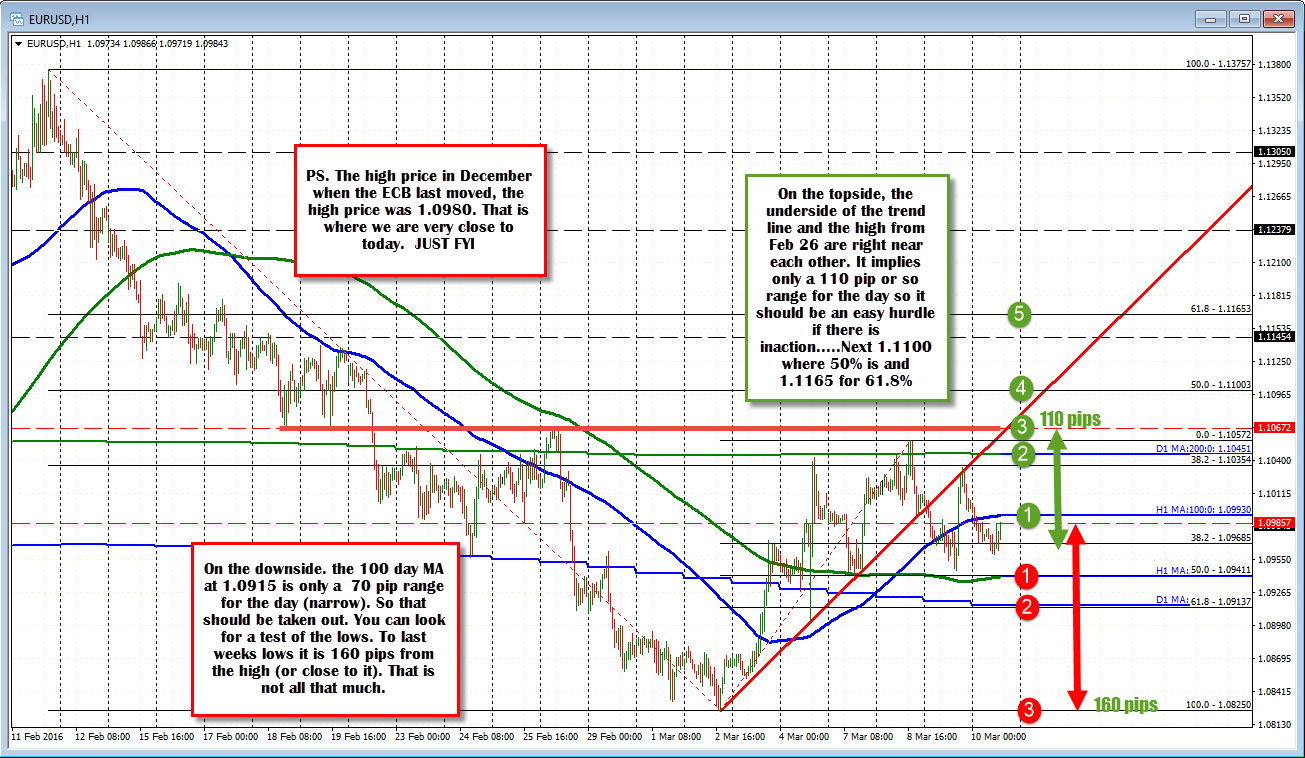
Before the event, I posted a chart with some comments on it. It looked like this:

This is what it looks like now. The price went down to the lower extreme and is now up at the higher extreme. It is not supposed to happen that way...is it? No! But it did.

The ECB did not have "inaction" as pointed out in the comments on the 1st chart. They acted. The price went "the right" (in quotations) way. Then the story started to change.
For me the "technical price action" started to change. I posted this chart (see chart below) with a simple comment...Why? Because it is the risk that can keep us out of trouble in our trading. I like to say "If the "risk" does not happen, the reward WILL happen". Other times I will say, this is the "line in the sand". Anyway, that line is the 100 day MA. The price should stay below that line in the sand/that risk line. If it does, the reward "will happen".

This is what happened (the "AFTER") (see chart below). I show it on the 1 minute chart because I want to show what happened at the 100 day MA (the line pointed out in the chart above). The price moves above the RISK. It nearly goes to the top of where the whole "story" started, and then goes down and tests the "line in the sand". That line holds. The 100 day MA holds support. The price action has changed.

The price then races higher - in one six minute stretch it goes 172 pips and squeezes above the 200 day MA at 1.10459. The pair corrects to the 38.2%, waffles around the 200 day MA and the last thing it does before moving to the highs is base for a few minutes right at the 200 day MA. Booster engines restarted and the price moved to the highs.

Price action - or technical price action - can tell a story that many do not want to hear. It can be really, really tough. It sucks to lose money. Especially when the story before the event said X and it ends up doing Y, but if you can be true to the price action...to the technical price action, you may get "risked out" (a kinder way of saying stopped out), and your reward may not "happen", but it might save you too.


