
How to properly read price action
Here's how I read price action. I use the EURUSD chart from the ECB meeting in May 2014
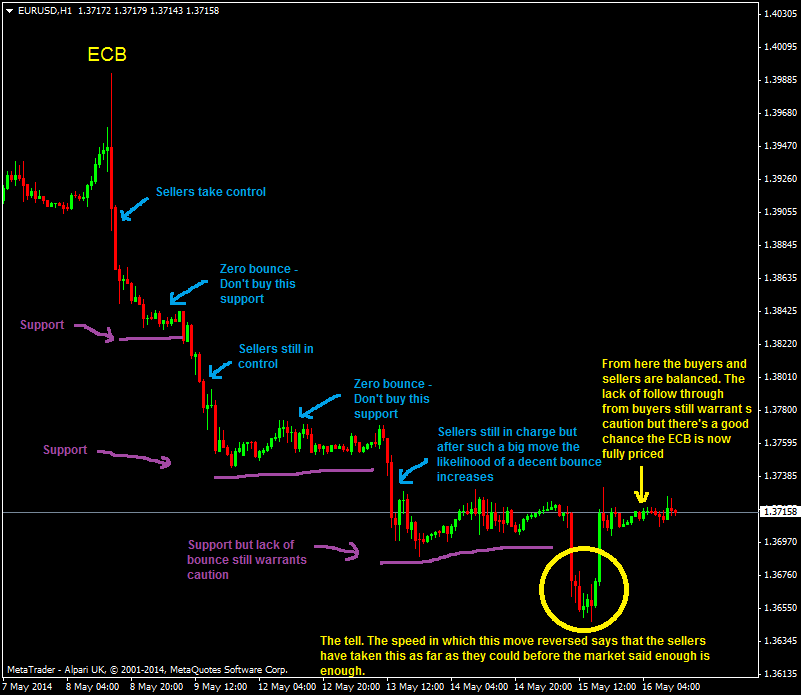
This is how I see it in its simplest form. We had a big event. Sellers took control of the market. They pushed it until it reached a point where the market said that’s enough.
Here’s that in more detail on the chart.

PA – My thoughts
Again, the key is not being able to look back and write the story after but to recognise each stage as it is happening in real time. How I view it personally is that it’s not an exercise in trying to find an opportunity in each part of the move but to see exactly how the market is behaving. That in itself is useful if you are already in a position as it can be the difference between winning and losing on that trade. What I also look for is whether the event in question justifies the price move seen, but that’s another part of it and slightly away from this topic.
If you look at any price right this second, you do not know whether the next move is 1 pip up or 1 pip down. That’s what we all see, the unknown. Staring right now at the price we do not know what the move is. We have to build up a picture but even then we have to let the market play out and paint it for us. The key is to see that picture as quickly as possible.
Price action is one small sliver of this trading game. It’s not the be all and end all of it but it’s useful in the here and now, when you’re staring at your screens wondering where the next pip direction is (and I’m talking in real time not an hour down the road).
Once you can see the levels it matters not what a price does in between but what the market tells you it wants to do.
Let the price paint the picture.

