
Adam had his preview up yesterday and it’s well worth a read, if you haven’t already
This is possibly the biggest central bank event since the market went potty over the Fed taper (Taking out the SNB as it wasn’t advertised). Currencies, stocks and bonds are all in with a shout of going barmy.
I’m very much undecided on how the market moves on this. We got a couple of clues yesterday on the QE headlines but the market has settled down within the recent range. Perhaps the biggest take is that the euro didn’t continue further down on the news. If mention of over €1tn in QE couldn’t shake the single currency lower that suggests that the market has priced QE in and are waiting for any reactionary drop to start exiting out of the shorts built up over the last 7 odd months.
The problem with the decision today is that there are so many variables. The Fed taper was a simple yes or no. This is QE and what it involves. There could be sovereign bonds, corporate bonds, changing of TLTRO amounts, eligible collateral questions, who actually buys QE plus tons more. It’s putting too many factors into one event and that’s not something I like. One headline could send the price soaring while another seconds later could send it crashing. I’m also unsure how it goes down. I believe that we’ll just get the normal rate decision and the QE stuff will come out at the presser, unless they are starting QE from now. It adds a bit more uncertainty to the release at 12.45 gmt so prepare for some volatile moves if QE details aren’t out with the initial release.

Draghi’s ready, are you?
This is in no way comparable to the SNB event but it potentially has the makings for some very fast and violent moves. First and foremost I’d advise anyone inexperienced and not in positions to sit this one out unless there is a clear consensus on the news that will define a move.
If I had to pick a bias it would be to buy into any sizeable dip on the headlines as we’ve come a long way in what has been almost one way traffic. There’s a big short position in the market and once a few head for the door it will become a stampede. It’s hard to see further big shorts added at these levels unless something really big is announced. Right now though the ECB has pinpointed a balance sheet towards 2012 levels of around €1.2tn and the expectations of €500bn and yesterday’s €1.1tn keep that number real. That’s ballpark the market will be playing in. Anything either side of that will bring the bigger reaction in the currency.
Usually I state the levels to watch so that we can see where a move is likely to peter out. in this case the news could change the tide for the euro so the levels may be just speed humps. I’ll list some anyway as even if they break they can then be watched for correction holding points. It may also be the case that we don’t get a big reaction in markets and I’m getting over excited about possible moves. It matters not as we should always be prepared for the big moves more than the little moves.
I’ll start with the long look and the weekly chart.
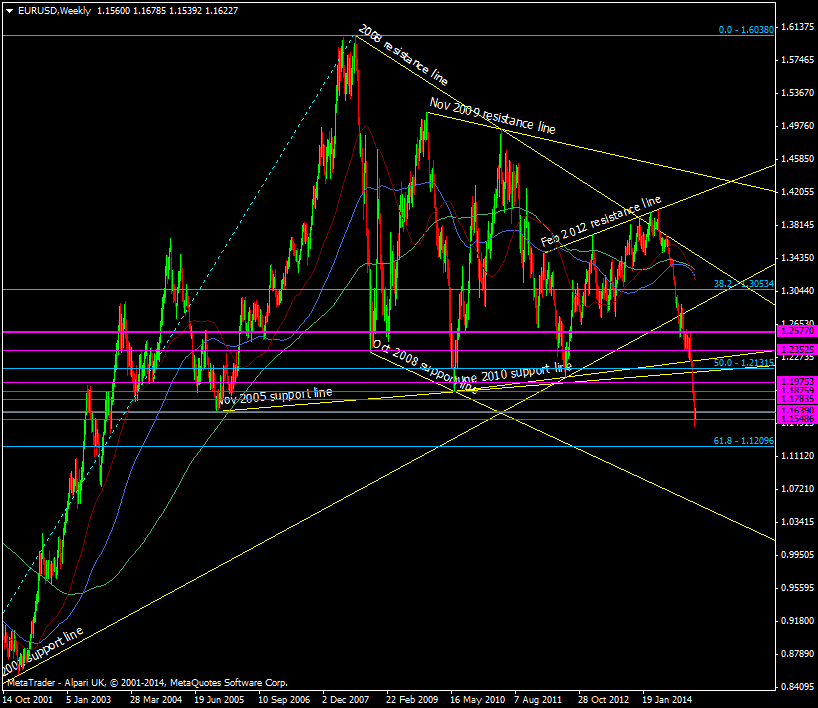
EUR/USD Weekly chart 22 01 2015
After the Nov 2003 low at 1.1375, the closest big downside level is the 61.8 fib of the 2000 swing at 1.1210, followed by the Aug/Sep 2003 lows around 1.0786/62,and then the Oct 2008 support line at 1.0585. All that’s probably a tad too far for any moves today but worth keeping in mind if we continue the trend lower. There’s not much else to glean from the downside so if you’re after a place to grab a dip you’ll need to watch the price action develop rather than lean on a particular level.
Going up the strongest looking area is around the broken 50.0 fib at 1.2130 up to the 1.2350 level. If we look at the daily chart we can see the levels in play in that area.
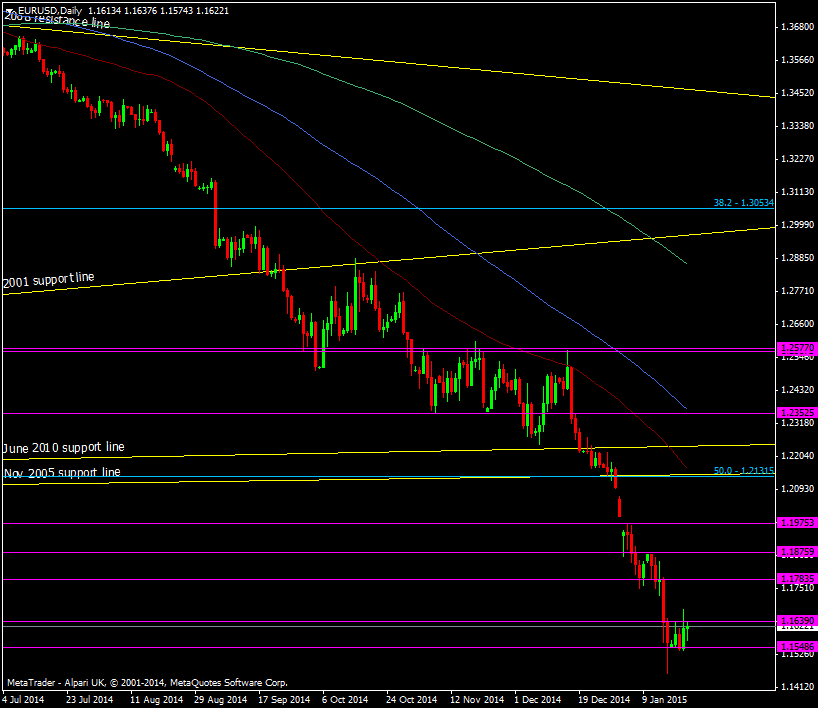
EUR/USD Daily chart 22 01 2015
Here’s what we have as resistance around there;
- 1.1975 – Became resistance after the break and gap down from 1.21
- 1.2116 – Broken Nov 2005 support
- 1.2131 – Old 50.0 fib of 2000 swing
- 1.2163 – 55 dma
- 1.2228 – 200 mma
- 1.2250 – Broken Jun 2010 support, confirmed resistance after Dec 22 break
- 1.2350 – Confirmed resistance after Dec 19 break and was a strong support area prior
- 1.2367 – 100 dma
There are also some levels that are worth keeping an eye on if the market doesn’t go potty and that’s the resistance points from here through 1.1783 (minor), 1.1875 (stronger).
That’s the levels I’m watching taken care of and it might be wise to check any communications from your brokers just to make sure that you’re aware of any margin changes that could affect your positions over the event. Stay safe everyone and if you’re trading it then the very best of luck to you.

