As the stocks go, so too does the JPY in trading. Or so it seems as the week’s trading gets of to an up and down start.
There was a report over the weekend that the Japan Government Investment Pension Fund would invest up to 25% of the fund in equities (see story Japan press Saturday: GPIF to lift ratio of domestic stocks to about 25%. This led to a 3.98% rise in the Nikkei. Stock gains have not been so hot in Europe however as the software giant SAP warned of an earnings shortfall and IBM earnings were a big miss. The Dow Futures are being negatively effected by the IBM tumble showing a decline near -90 (IBM is a big influence on the average and it is down about $12) but the S& P and Nasdaq are not as effected. In fact the Nasdaq Futures are now showing small gains.

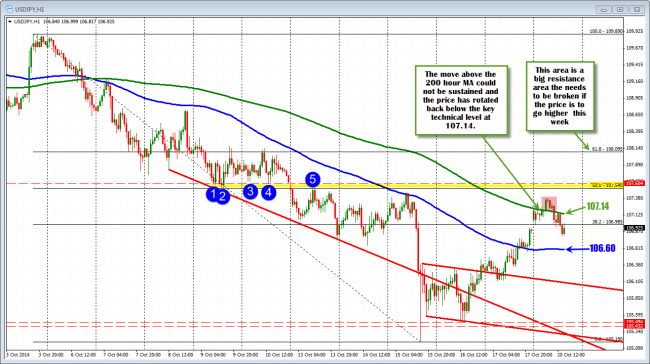
USDJPY took a look above the 200 hour MA but failed.
The JPY has been following the flow of the stocks. In the Asian session, the bullish recovery from the Wednesday low, continued (SEE:weekend video: FOREX: Technical Analysis for USDJPY. Looking more bullish into new week ), and the price of the USDJPY moved above the 200 hour MA (green line in the chart above at 107.14 currently ). However, the next target at the highs from last week and the 50% of the move down from the October high (at the 107.54 level) could not be reached (the high stalled at 107.38). Lower stocks in Europe, helped reverse the trend. From a technical perspective, the USDJPY price retreated back below the 200 hour MA (and stayed below it – see green line above)
The USDJPY price is back trading near the close from last week at the at 106.89, and sits between the 100 hour MA below at 106.60 and the 200 hour MA above at the 107.14. The movements today – with no economic data scheduled to be released- will likely follow the flows from the stock market. In fact that may be a continued theme this week as the US calendar is fairly light, and the technical picture in equities is better than what it looked like at Wednesday’s lows, but still has some work to do to get above the key 200 day MA in the S&P (at 1906 area vs. close from Friday at 1886.76). Much may depend on how the stocks perform (I just don’t like trading currencies off stocks, but….)
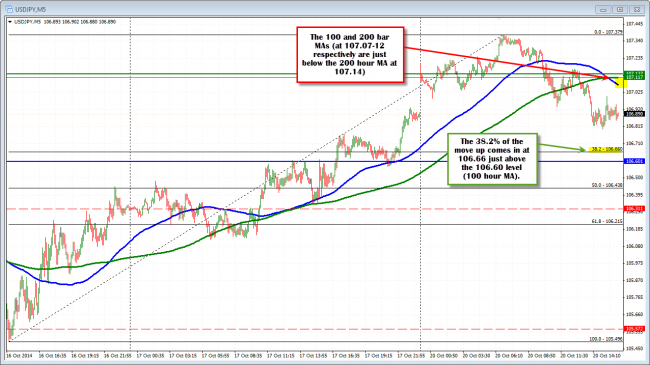
Look for patient buyers on dips against the 100 hour MA and now that the move above the 200 hour MA failed, I would expect sellers to line up near the 200 hour MA at 107.14. Looking at the 5 minute chart below, the technical levels support that idea as the 38.2% of the move up from Thursday’s low comes in at 106.66 (just above the 106.60 100 hour MA) and the 100 and 200 bar MAs on the chart come in at 107.07 and 107.12 – just below the 107.14 200 hour MA level). The 5 minute chart is intraday bearish below those topside moving averages)

The price on the 5 minute chart is in between support and resistance on it.


