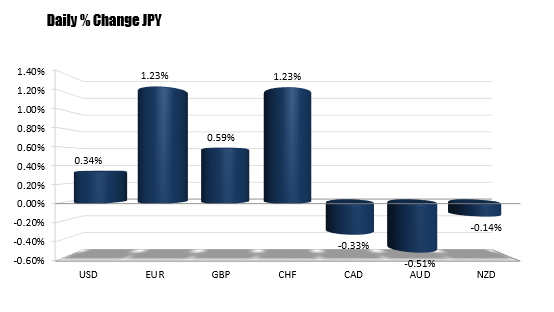
The JPY has been a focus currency of late with the bias being to the downside. The currency is higher today against most of the major currencies except the commodity currencies (CAD, AUD and NZD) but overall, the changes are somewhat minimal.

The USDJPY is mixed today, up a little against the EUR, GBP, CHF and USD, but down against the AUD, CAD and NZD
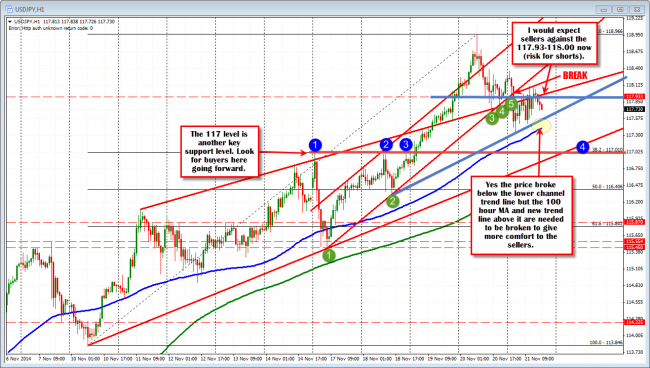
Looking at the USDJPY, the pair is down on the day, fell below some trend lines in the process (see chart below), but has a bunch of red and green bars indicative of a “market” that is more ambivalent at the moment. It seems to be taking in the action of the EUR and is enjoying being in the background.

The USDJPY has some bearish/consolidation clues, but remains above key support too.
The pair remains above the 100 hour MA (blue line in the chart above) and seems to be forming another trend line on the downside, above that MA level. So although there is a move below the trend lines, the action suggests it is more “just because it ran out of upside speed”. A move below the 100 hour MA (and staying below) would be more of a bearish event.
Can sellers take some joy? Yes. Can you sell? Yes, there is the break and slowing of the rally. Are they comfortable? Not totally (watch 117.93-118.00 as risk – the 117.93 was the high going back to October 2007). The buy the dip remains more of a theme vs. the high is in place. Get below the 100 hour MA (blue line in chart currently at the 117.42 level) and comfort may be increased, but the 117.00 level remains another key support level that should give cause for pause on any sell off (old ceiling high and the 38.2% retracement is at the level).
PS..I should also point out, that correction from the high to the low is 160 pips. The Adam 150 pip rule is in effect (of course it gets harder as the price trends higher).


