
1.7042 is as far as we’ve come so far and 7 pips short of the spike low on Friday.
We’re also having another look below the Oct 2013 support line
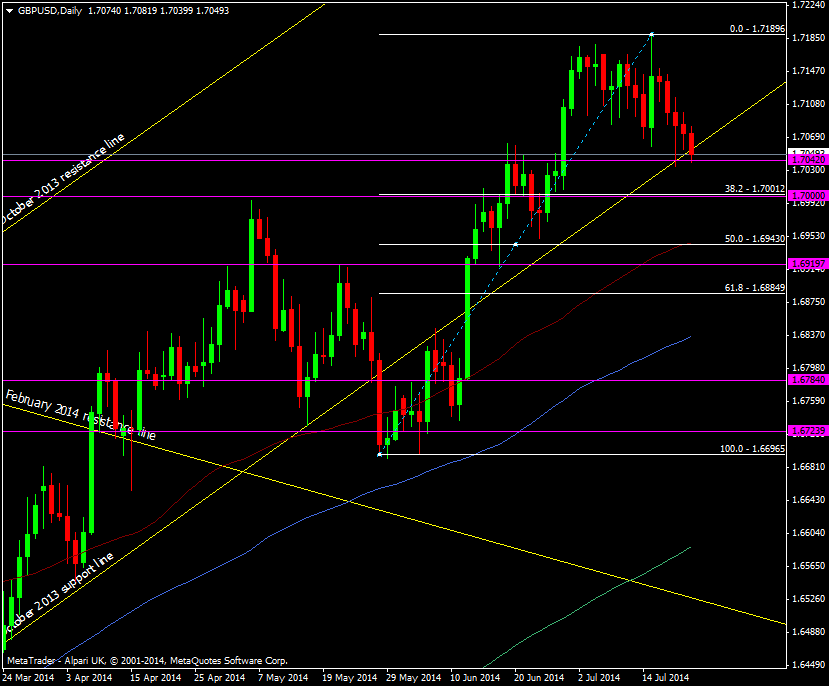
GBP/USD Daily chart 22 07 2014
A fall through support here would see the 1.70 level come into focus which also marks the 38.2 fib of the May swing up. Under that the 50 fib also coincides with the 55 dma and the 100 mma at 1.6935
We’re slowly creeping further and further away from the recent highs and although there is some dollar moves behind it I wouldn’t get complacent that were done at the highs. Retail sales and GDP later in the week may not cause us to stray too far.

