
March US inflation data
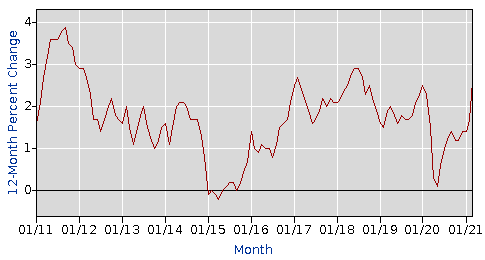
- Prior was +1.7%
- Ex food and energy +1.6% vs +1.5% expected
- Prior ex food and energy +1.3%
- CPI +0.6% m/m vs +0.5% expected (highest since 2012)
- Prior m/m reading was +0.4%
- CPI ex-food and energy +0.3% m/m vs +0.2% expected
Wage data:
- Real avg hourly earnings +1.5% vs +3.4% y/y prior
- Real avg weekly earnings +3.9% vs +4.1% y/y prior
This is the sort of number that leads an inflation-skittish market to breathe a sigh of relief. Yes, it's a tick higher than expected but it's lower than feared and isn't the kind of number to bother the Fed.
The US dollar is largely unmoved on the release.
Drilling into the details, half the headline rise in March was due to gasoline. The core rise reflected higher rent and auto insurance premiums.

