
Highlights of the third look at Q1 GDP:
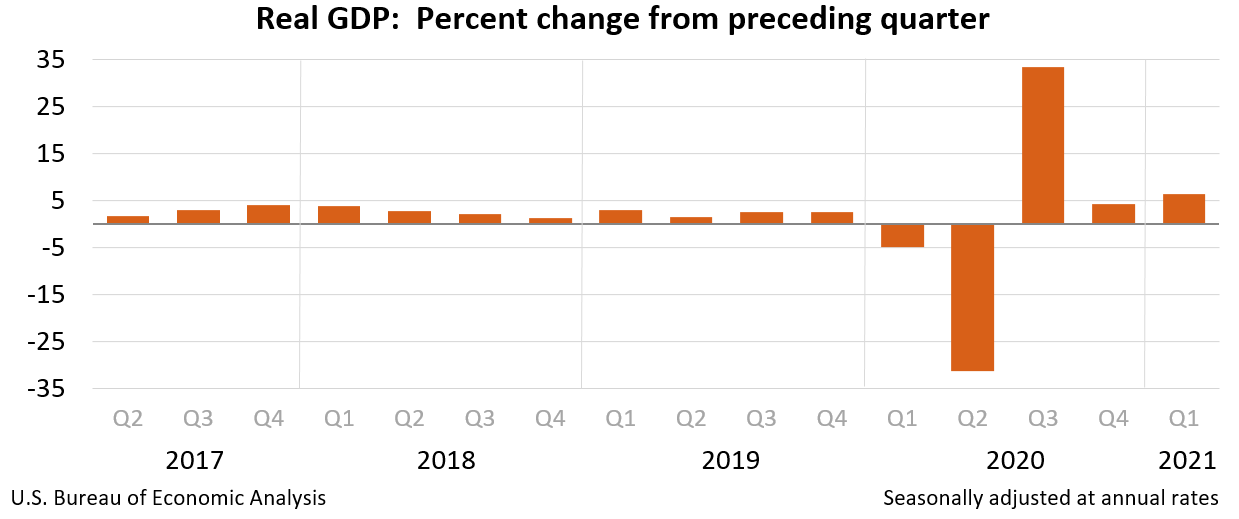
- First reading and second reading were +6.4%
- Final Q4 reading was +4.3%
- Personal consumption +11.4% vs +11.4% expected
- GDP price index +4.3% vs +4.3% expected
- Core PCE +2.5% vs +2.5% expected
Details:
- Ex motor vehicles +6.5% vs +6.5% second reading
- Corporate profits after tax +1.7% vs -0.8% in second reading
- Final sales +9.2% vs +9.4% second reading
- Inventories cut 2.67 pp from GDP vs -2.78 pp from GDP in second reading
- Net exports cut 1.5 pp of GDP vs +1.2 pp from GDP in second reading
- Govt spending adds 1.02 pp to GDP vs +1.02 pp to GDP in second reading
- Business investment +11.7% vs +10.8% second reading
- Business investment in equipment +15.0% vs +13.4% second reading
- Exports -2.1% vs -2.9% second reading
- Imports +9.5% vs +6.7% second reading
- Home investment +13.1% vs +12.7% second reading
The third reading is rarely a market mover. We get the first look at Q2 GDP at the end of July.
The largest boost to GDP in industry terms was from durable goods manufacturing while the largest drag was non-durable goods manufacturing. Overall, 17 of 22 industry groups contributed positive growth.

