GDP, Industrial Production, Retail Sales all released at 10 PM ET/0200 GMT
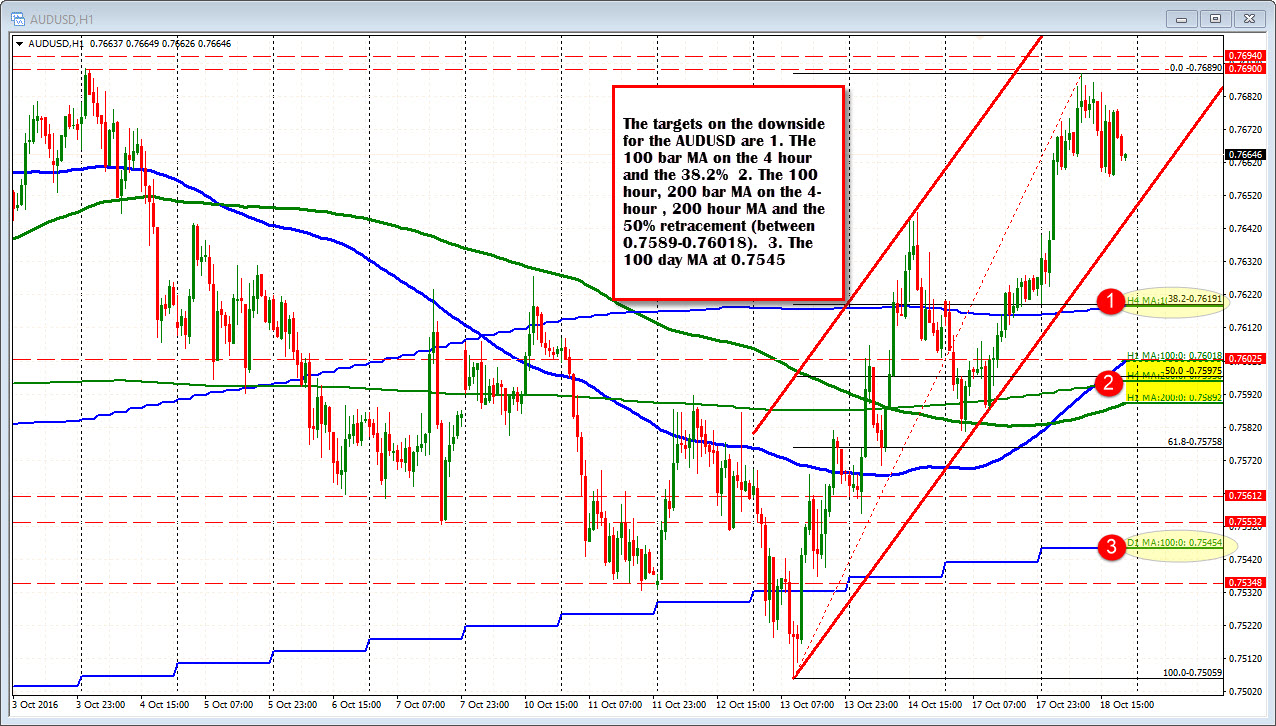
The AUDUSD has moved higher in trading today but fell short of the October high by a few pips. The high today reached 0.7689. The high for the month reached 0.7690 on October 3rd.
Since the peak , the price has been up and down with a low of 0.7658. So activity has been contained in a 31 pips range over the last 11 or so hours.
The pair is buying time.
Buying time for what? Well, there is a boat load of key economic data coming out of China today and depending on how that data comes out, will help determine the fortunes of the AUDUSD. Generally speaking, better data is good for Australia and the AUD as they funnel exports to China (especially natural resources). Lower than expected data, and the AUDUSD will falter.
What is on tap?
- GDP (3Q). The 3Q GDP (q/y) will be released with expectations of a 6.7% (q/y). The QoQ SA change is expected to come out at +1.8%.
- Industrial production YoY. The is expected to rise by 6.4% YoY. The YTD is expected to be a slower 6.1%
- Retail Sales. Retail sales YoY is expected to rise by 10.7% (vs 10.6% last month yoy) The YTD retail sales is a slower 10.3%.
What are the key technical levels to eye?
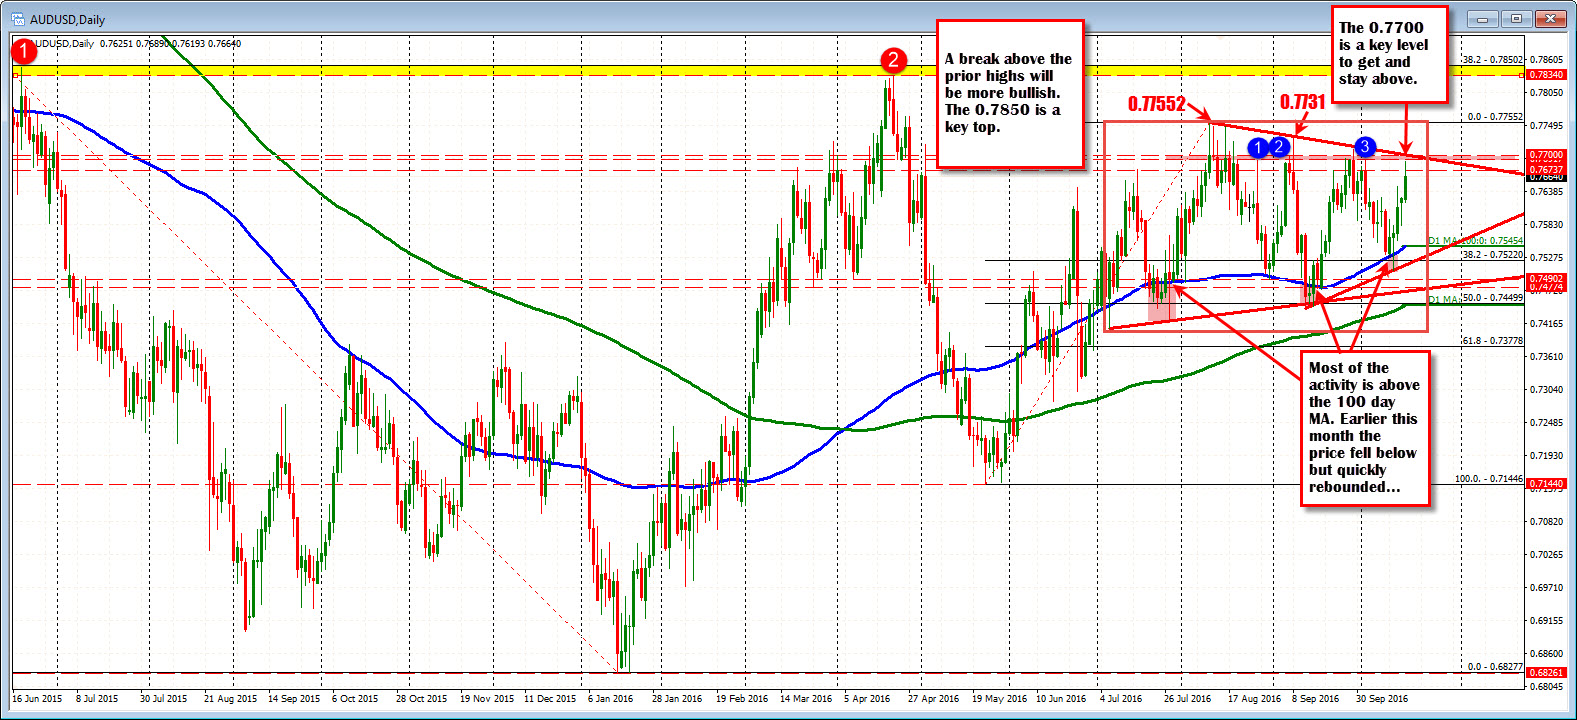
Technically, looking at the daily chart the last 3 months has seen the pair move up and down between 0.7400 and 0.7750 (roughly - red box). The shorter 2 month range is about 50 pips more narrow. It extends from 0.7450 to 0.7750 (300 pips). As mentioned above, the 0. 7690 level has stalled the topside this month. Also of note is the highest close going back to March is 0.7700 and the downward sloping trend line that cuts across at the 0.7700 area
As a result, if I were to have a level that would define a more bullish market technically, it would be above the 0.7690-0.7700 level. Get above and stay above that level and things are looking more bullish for the AUDUSD. On a move above that level, traders will target the prior swing highs. They come at:
- 0.7731 - The high from September
- 0.77552 - The high from August
- 0.7834 - The high from April and the high for the year.
- The 0.7850 level is the 38.2% of the move down from the July 2014 high. That is also close to the June 2015 swing high.
How about on the downside?
Looking at the same daily chart, what sticks out to me is how the price has traded mostly above the snaking 100 day MA (blue line in the chart above) over the last 3 months. This month, the price had one dip below the level and that was quickly reversed (closed above). In September, the price moved below, closed two days below the line and then rallied higher. In August there were no closes below the 100 day MA. That MA currently comes in at 0.7545. The MA is about 120 pips away. Any closer levels?
Looking at the hourly chart,
- The 100 bar MA on the 4 hour chart and the 38.2% of the move up from the October 13 low comes in at 0.7619.
- Below that there is a cluster of MAs adn the 50% retracement of the same move higher between 0.7589 and 0.76018. Moviing below that area should be move bearish as well.
There is a lot of data, and there is the risk that one is strong/one is weak. That can cause up and down moves. So be aware of expectations and if there is a clear bullish or bearish winner, you have the technical levels to follow and lean against.