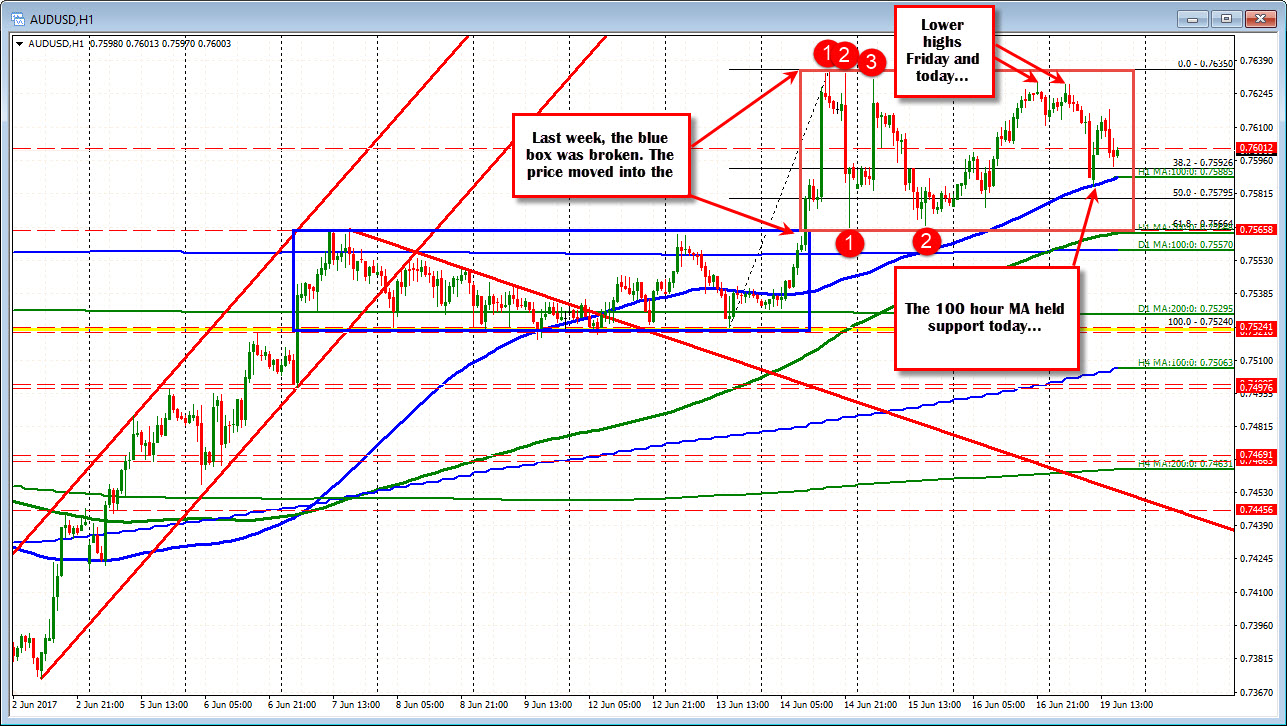
Lower highs on Friday and today...
If you recall, last week the AUDUSD extended out of a narrow 40+ pip box (blue box in the chart below) on the break of the ceiling at 0.7566. That old ceiling was tested on June 14 and again on June 15. Needless to say, that level is a key support level going forward.

On the topside, the 0.7635 level has become a good ceiling/resistance level. There have been 3 highs in the 0.7631-35 area. The last two trading days has seen lower highs (at 0.7529 and 0.7528 respectively). The support and resistance creates another box (this one is red) that is between 0.7566 and 0.7635.
What now?
Well, the break of the box (either to the upside or downside) should solicit more buying or selling. Is there clues in between the extremes?
Looking at the hourly chart today, the high did come up short of the 0.7635 ceiling, but on the downside, the pair bounced nicely off its 100 hour MA (blue line in the chart above). That 100 hour MA now comes in at 0.7588.
Stay above is more bullish. Buyers against that level have to target the 0.7635 level (the high of the red box).
Move below is more bearish, with the sellers then targeting the low of the red box at the 0.7566 level.
The buyers did their thing against the 100 hour MA so they have won the last battle. Can they keep the buying going now or will that 100 hour MA be broken. That is the trade.


