UK/EU deadline looms
As Mike reported over the weekend, the 4 Dec deadline imposed by Tusk et al for the UK to bring an improved offer to the table is upon us and there will be meetings with the UK/EU today (see all the details from Mike's weekend post here).

Hopes for a resolution, in addition to a nice bounce off some key technical support, has the GBPUSD higher on the day.
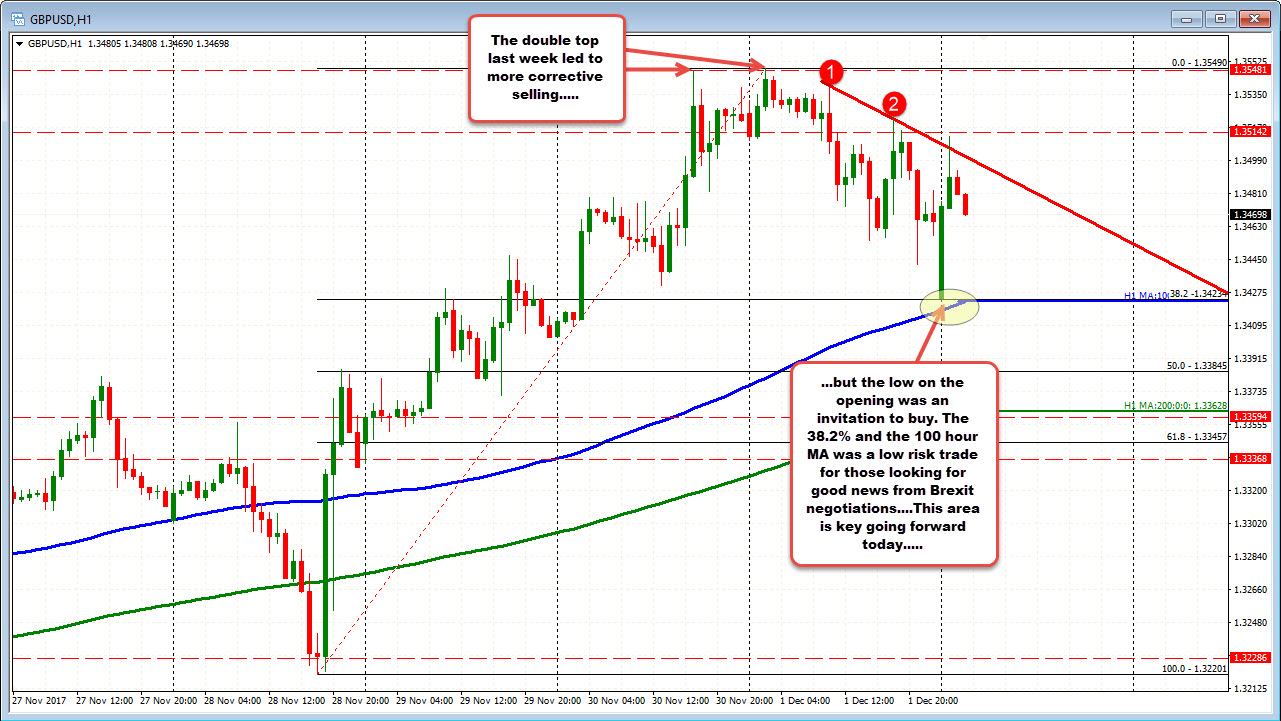
Looking at the hourly chart above, the pair gapped lower on the opening but did stall right at the 38.2% at 1.34234 and just above the 100 hour MA (blue line in the chart above) at 1.3418 (at the time - it is now at 1.3423 as well).
The holding of that support, led to a nice bounce that took the price up to a high of 1.3512. The price has since rotated back lower and trades at 1.34742.
The holding of the 38.2% and the 100 hour MA makes that a good technical level going forward through the fundamental news later today. IF there is disappointment, a break below that level will turn the bias from more bullish to more bearish. Store that level away for the day and look for stops on a break.
Until then, the buyers are more in control.
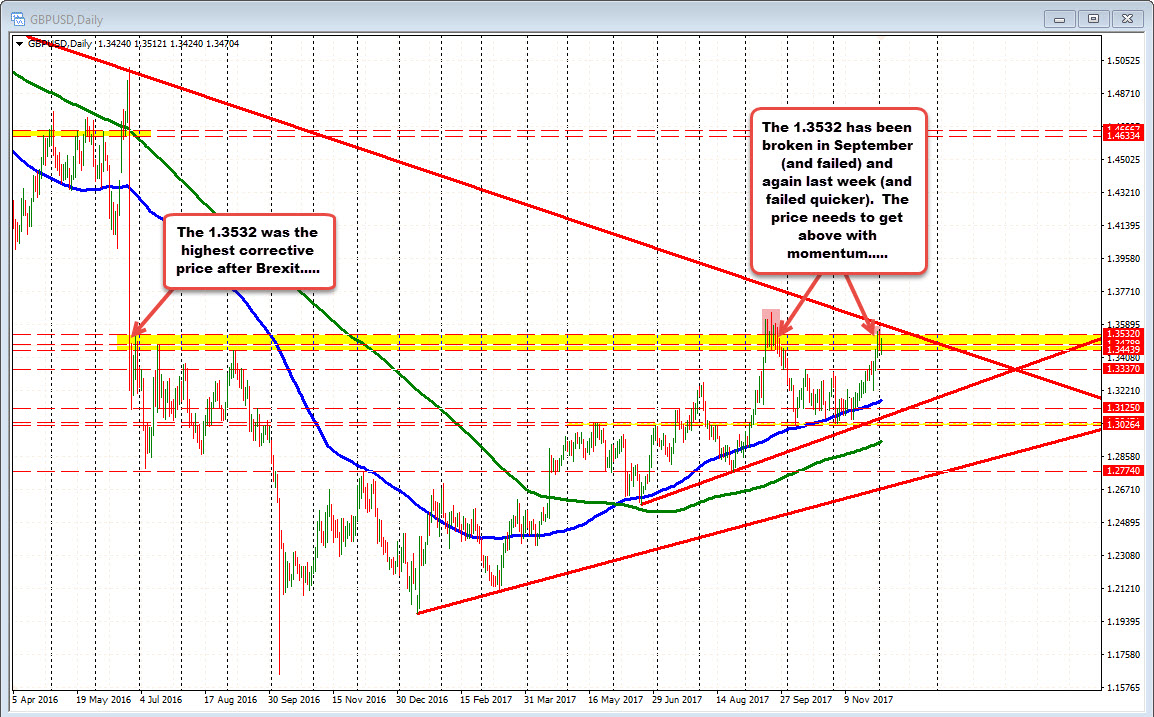
ON the topside, I will continue to look toward a move above the 1.3532 as a level to get and stay above if the buyers are to take more control. Looking at the daily chart below, that level was the highest high immediately after the Brexit vote in June 2016.
Here we are nearly a 1 1/2 years later, and there is hopes on progress in the Brexit process. Most think that would be beneficial for the GBPUSD if there is progress (there is a long way to go though so watch the levels). However, getting and staying above should give the pair more of boost.

PS the price did try to go above in September (and failed) and last week (and failed even quicker). So buyers will be looking for momentum on a break (you should too!).
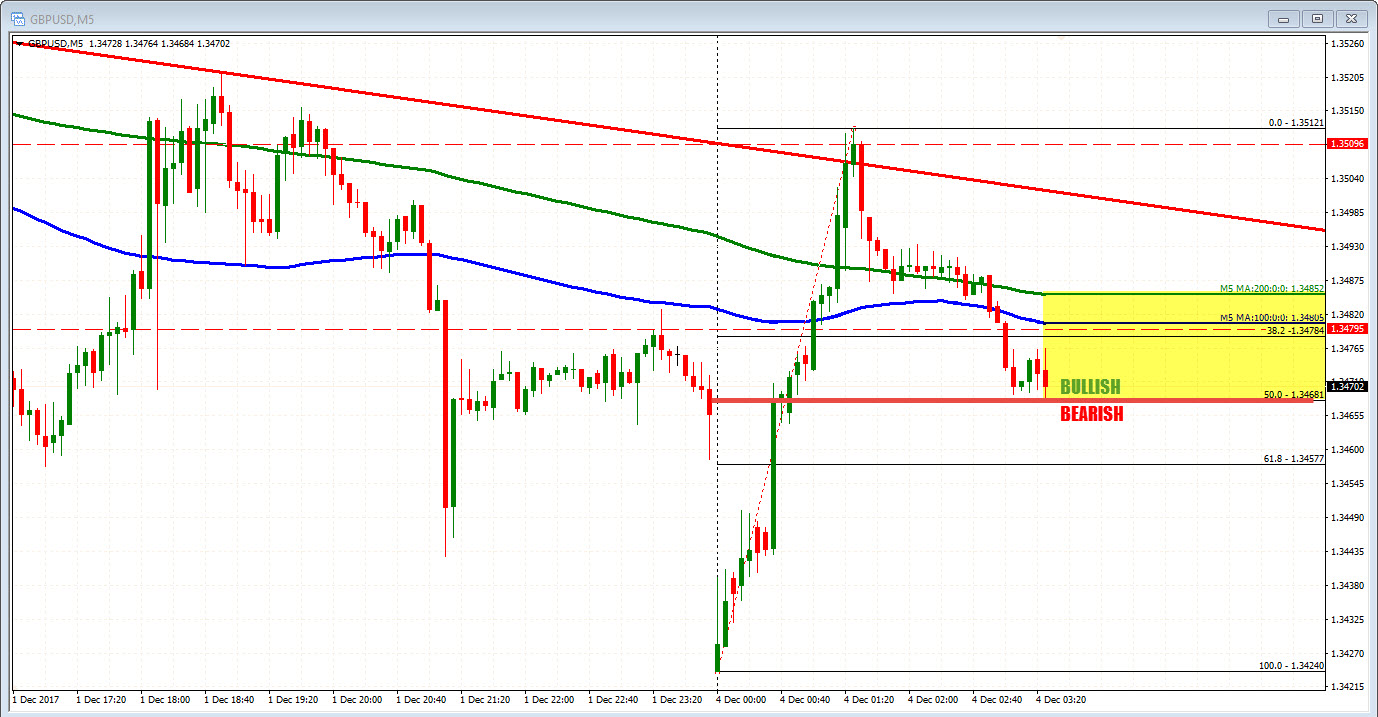
PSS in between the 1.3532 and the 1.3423 level can lead to choppy, up and down markets. The price is trading around the close from Friday at 1.3470 area. The 50% of the day's trading range is 1.3468. So that area may be a barometer for bullish/bearish. Stay above is more bullish. Move below is more bearish (although that is just a guess. The 100 and 200 bar MA on the 5-minute come in at 1.3480-85. Getting above those levels (we are below now) would be more bullish too.....


