Also above trend line...
The USDCAD is looking to test the buyers resolve.
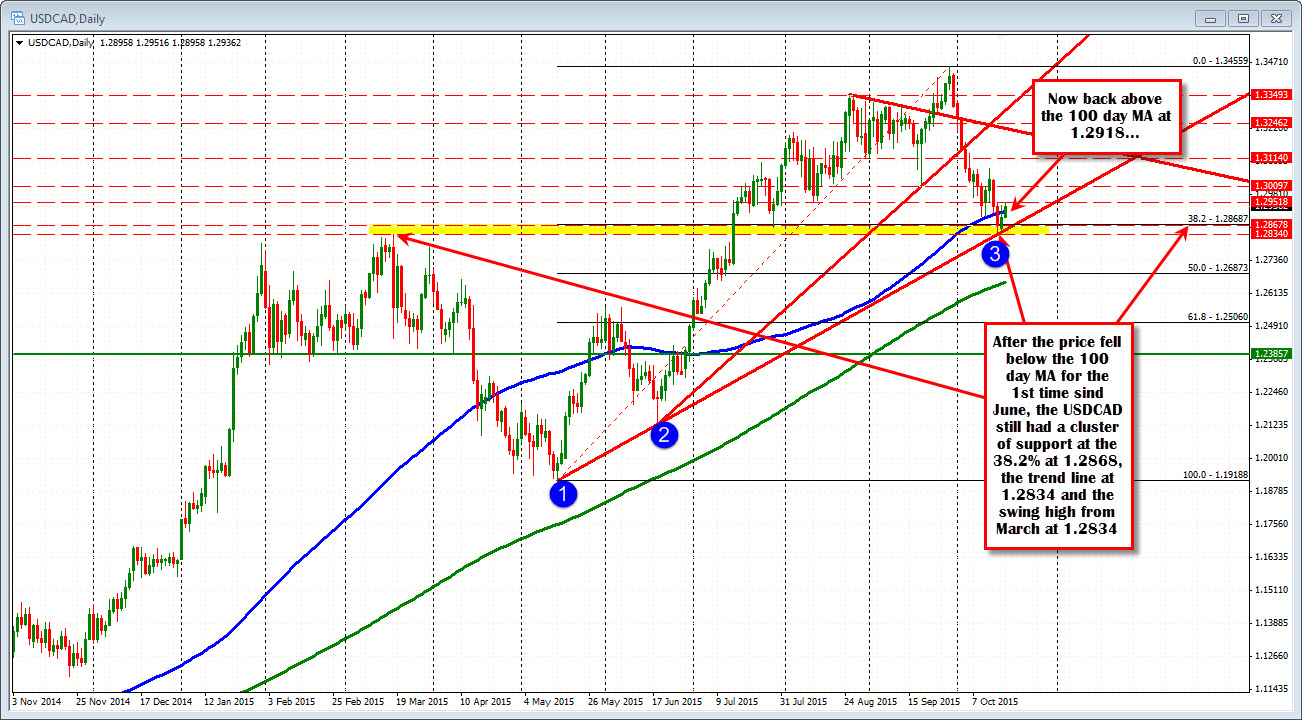
The pair has been stepping lower since peeking at the 1.3456 level back on Sept 29th and reached a low of 1.28313 on Thursday. That low saw the price move below the 100 day moving average (blue line in the chart above) for the 1st time since June 29th (the 100 day MA is currently at 1.29186).
The break below the key MA had other support levels to contend with including the:
- 38.2% of the move up from the May low at the 1.28687 level,
- trend line support at 1.2834 and
- the swing high going back to March at the 1.2834 level (see chart above).
The decline stalled at 1.2831 - just below the lowest of the cluster of support targets (bullish bottom ).
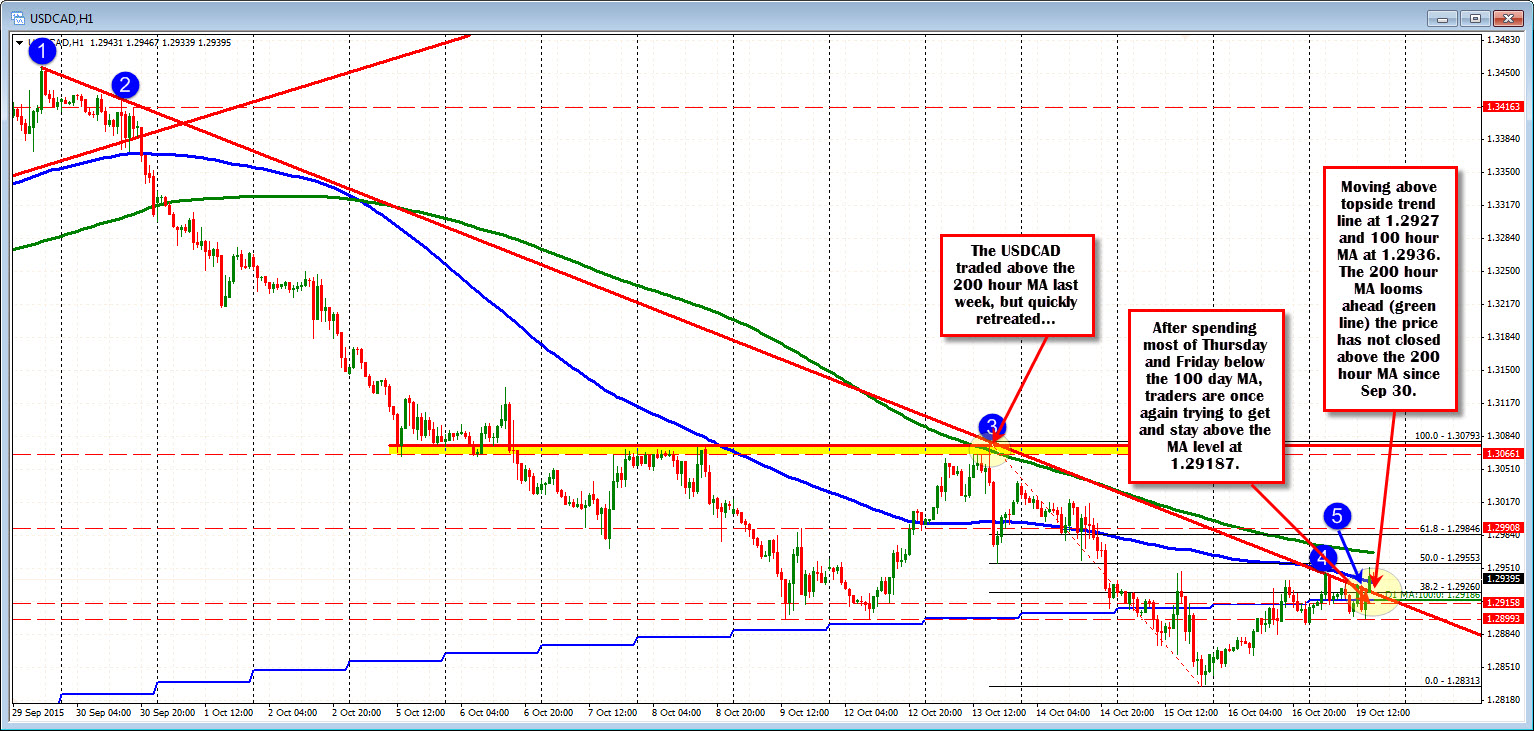
The price is now higher with the current price back above the 100 day MA at the 129188 level
Looking at the hourly chart below, the price is also now above the 100 hour MA (blue line in the chart below) and trend line resistance (see blue circles in the chart below). This increases the pairs bullishness. Stay above the 100 hour MA and trend line (at 1.2937 and 1.2925 respectively - currently) and the buyers remain in control. The next key target comes at the 200 hour MA (green line in the chart below) at 1.2967. The price moved above the 200 hour MA on Tuesday but quickly retreated. The last close above the 200 hour MA was on September 30th.
Buyers are making a play. Can they take and keep control from the sellers? Watch the 100 hour MA for support now (that is risk for buyers).