
Also cracks the 38.2% retracement of the move down from end of May high.
The USDJPY has moved above the 100 day MA AND the 38.2% of the move down from the end of May high to the June 24 low. The levels come in at 103.74 and 103.76 respectively. The move above the 100 day MA is the first time since February 2nd 2016.
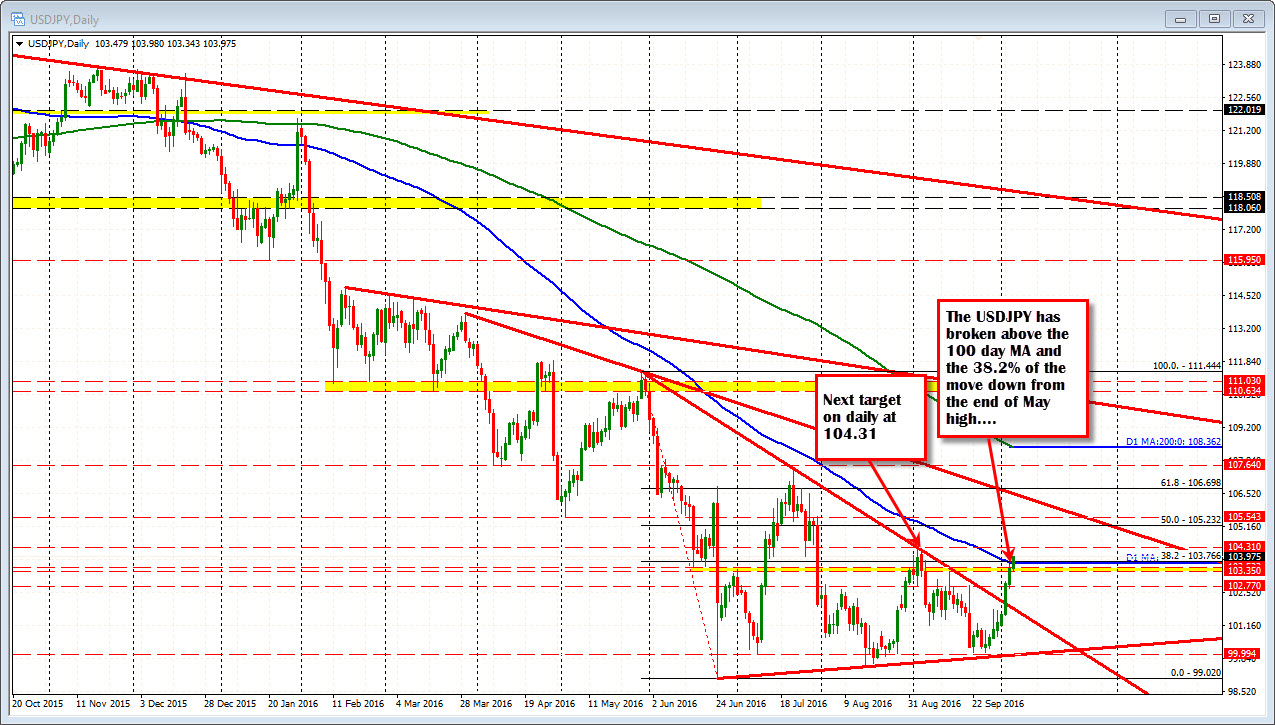
On a move above the 100 day moving average,
- The high from September 2nd at 104.31 becomes the next target.
- Above that and 105.23 (50% of the move down from the end of May high - see chart above)), and
- 105.54 (swing low from May 3rd) become targets.
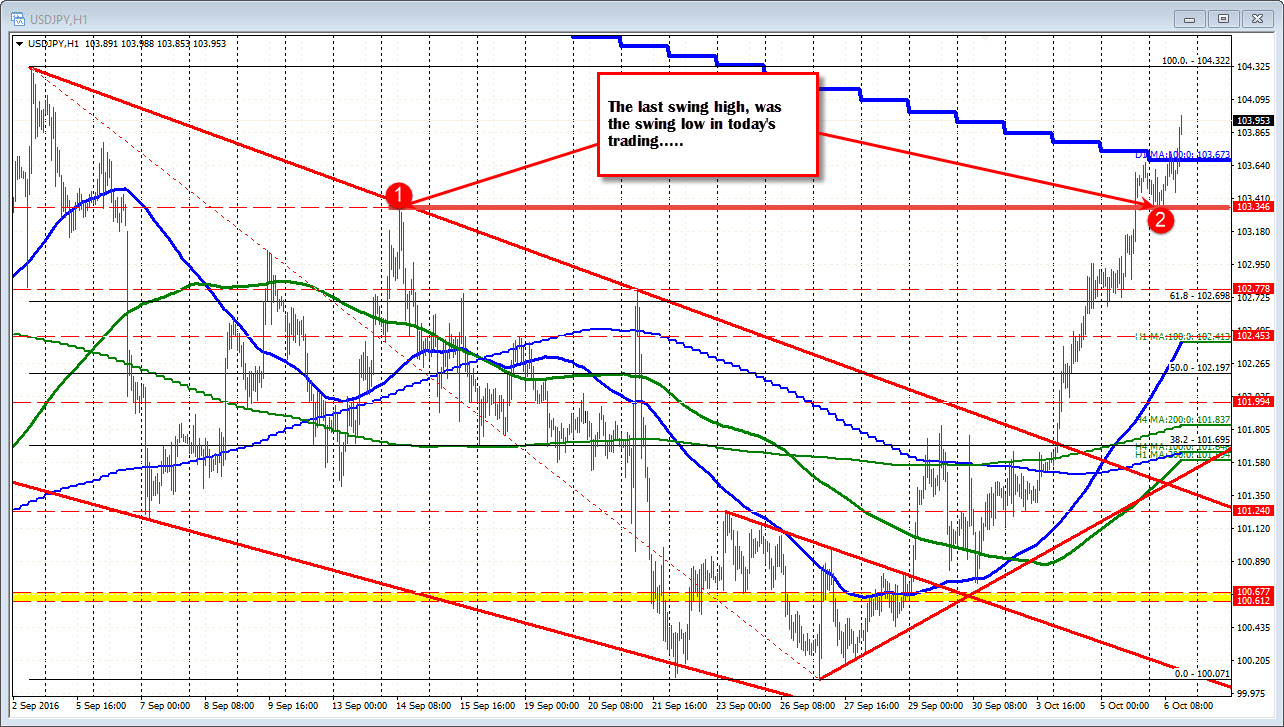
Important from a technical perspective is the low for the day. That low came in at 103.35. that low was equal to the swing high going back to September 14 (see llower yellow area in the chart above and the Red LINE in the hourly chart below). Holding that line gave traders the go ahead to push higher technically (refer prior post HERE).
NOTE: The daily charts I use are 5-day charts. If your 100 day MA line is a lot different, it is likely because your broker uses a 6-day work week. That is, they include the few hours of Sunday trading when NZ traders are leading the way as a full trading day. That skews daily MA lines markedly but it is not industry standards.

