
Gold is trading up by over 5% since the start of the month
Despite a bit of a pullback from $1,900 from earlier in the week, gold has had a stellar month so far and if the seasonal pattern is anything to go by, January promises to be yet another solid month for gold buyers.
As things stand, gold is up over 5% on the month and hasn't had a losing December since 2016 as the typical January buying has started to spill over into December in recent years. The seasonal chart shows gold has not had a losing January since 2013:

However, as we drill down to the charts:
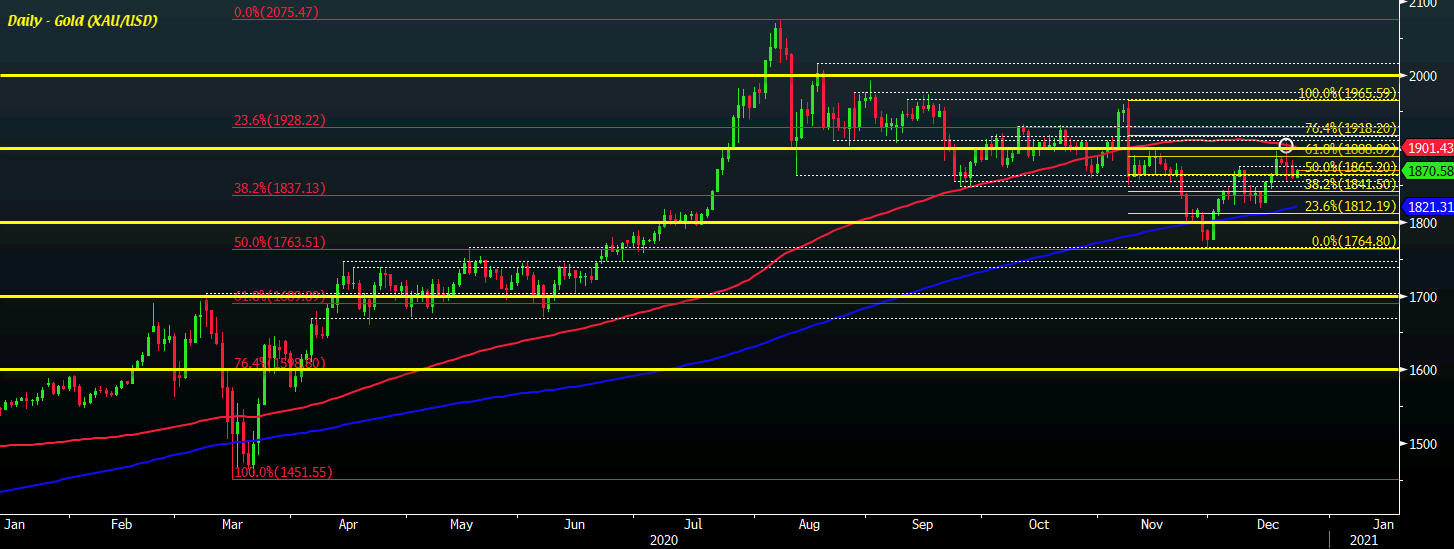
The pullback in gold from earlier in the week comes as we see price action test $1,900 and the 100-day moving average close to $1,904 at the time.
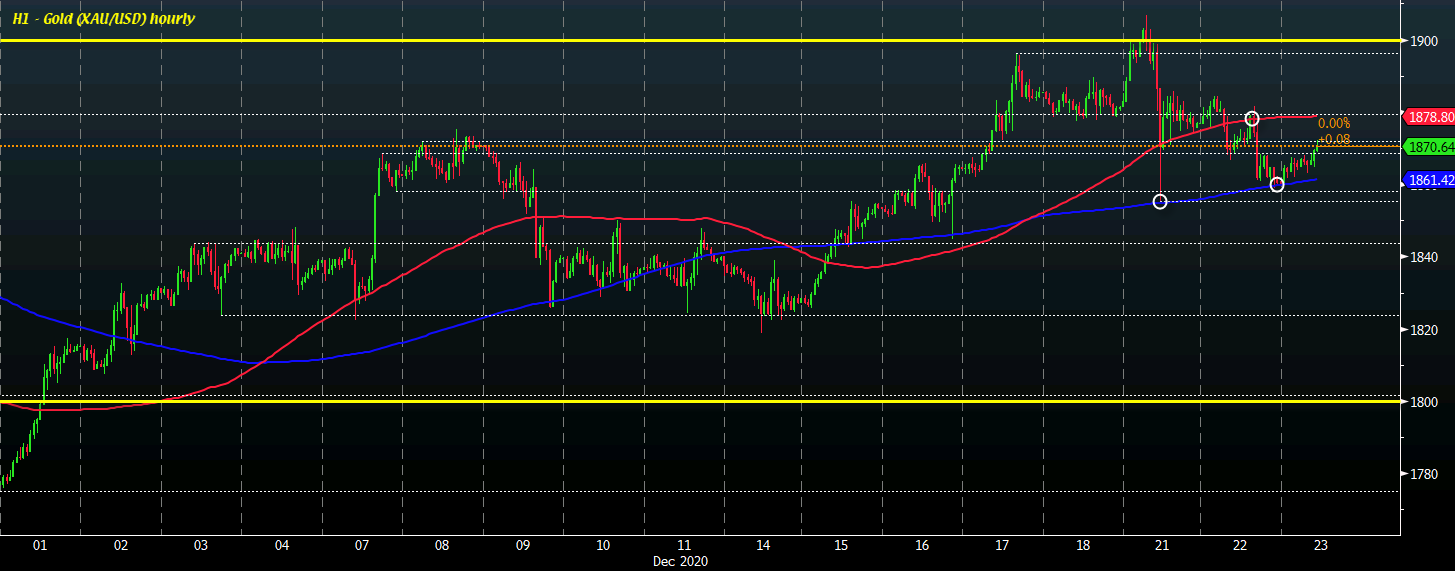
The drop was rather quick on Monday but buyers held on to the 200-hour moving average before price consolidated between that and $1,880 levels for the time being.
Of note, buyers are still defending the key near-term level since overnight trading with price action now resting in between the key hourly moving averages.
That hints the near-term bias is more neutral for now as the year starts to wind down.
Although gold has had a stellar month so far, there are key levels that it needs to break in order to extend the upside momentum currently.
A push back above the 100-hour moving average (now @ $1,878.80) will see buyers seize near-term control but the key level they need to break will be the $1,900 handle as well as the 100-day moving average (now @ $1,901.45).
That sort of momentum might not come until we get into January trading, which looks promising for gold (⬆). But with some "front running" on the seasonals already taking place, can gold make it eight years in a row that it starts off with a win?
Buyers are certainly not giving up hope just yet as seen by the near-term price action but we'll see once the market gets back into full swing in two weeks' time.

