
A chart from GS on WTI as the oil price is setting off into the new trading week with a bit of a slide here in Asia
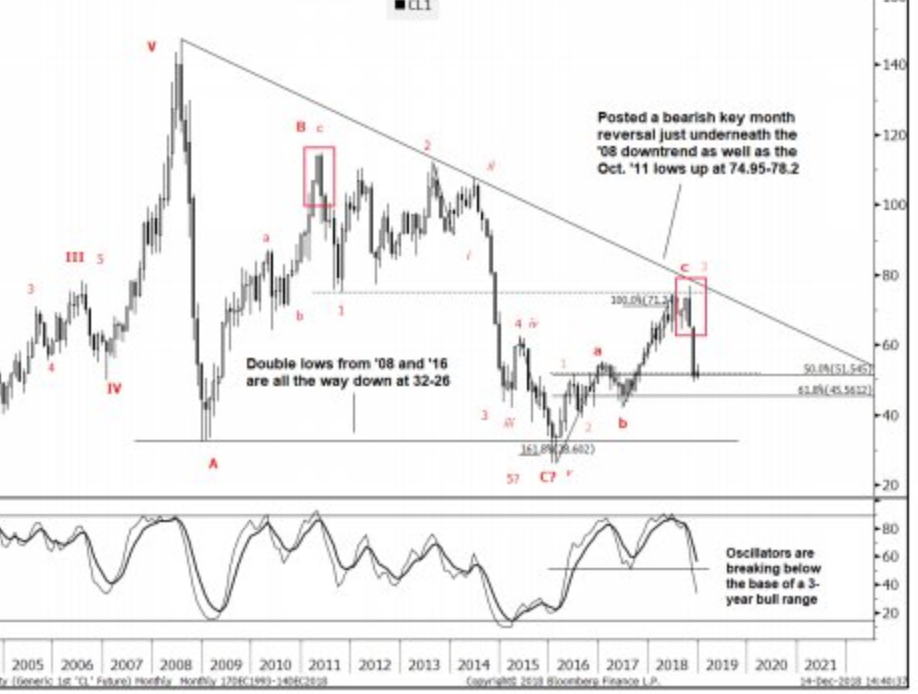
Comments accompanying the chart (in brief):
- Oil has breached 51.67 interim high from June 2016
- Contact with 51.67 diminishes any possibility that this might be a 4th of 5-waves from early-'16
- in effect exposes serious downside risks
- It's now possible to argue that the entire rise from the '16 lows was counter-trend
- ... In terms of levels to be aware of, WTI is currently testing 50% retrace at 51.47. The next retrace to note is 61.8% all the way down at 45.47.
- Worth pointing out that monthly oscillators are coincidently breaking below the base of a three year bull range, supporting the view that further weakness is likely on the cards.
View:
- initial congestion 51.47-50.00
- next notable support 45.47
- reassess above 56.55
---
I can't say I am a user of Elliot Wave, but if anyone is comments welcome!

