
Oil still down by a little over 1% on the day so far
Eamonn had the story earlier today here.
The news is supposedly weighing on oil prices to start the week but I would also argue that is does have some technical undercurrent to it.
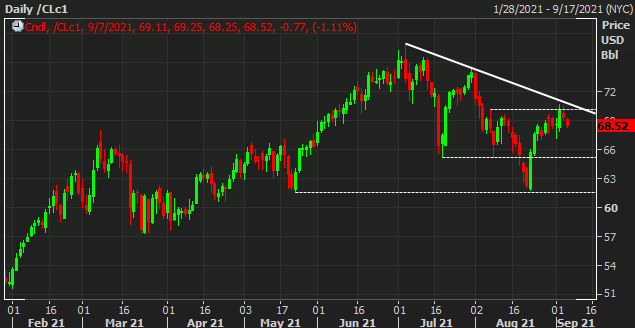
The climb towards the end of last week stalled close to $70 on the daily, also keeping below the trendline resistance and that is pinning prices back for the time being.
As mentioned earlier last week:
Looking at the daily chart though, we can see that oil gains continue to see some resistance closer to $70 for the time being and that is perhaps part of the story here.The 100-day moving average (purple line) is also a key technical support level to watch adding to the near-term level highlighted above, so that provides the key region that buyers must keep above in order to sustain the latest upside leg.Otherwise, oil may yet be caught in a bit of a tug of war between the May and August lows around $61.70 to the $70 mark until the fundamental picture sorts itself out.
Bolding what I feel is still relevant as we look towards price action this week.
The 100-day moving average today is seen @ $68.51 and that is a key technical region to watch in order for buyers to maintain some of the upside momentum in August.
For now, the fundamental picture dictates that OPEC+ is unfazed by delta variant concerns and are pushing forward with plans to step up output. However, the market is arguably still having some doubts, especially when economic data globally is slowing down.

