
We're not out of the woods by a long way but if you just give it time the technical picture develops
For now the pound has found its level between 1.23 and 1.24. Does this mean we jump in and start going elbow deep in trades? Of course not but what we do see, if we allow it time to happen, is that the levels start developing. It's like an old house that's been torn down and we're now seeing a new one going up.
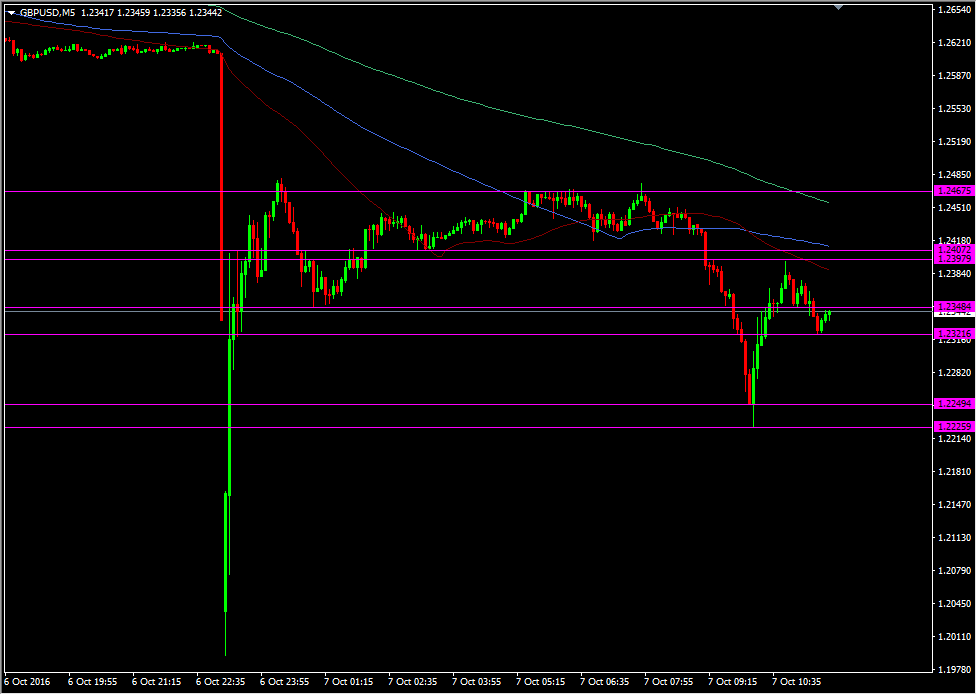
GBPUSD 5m chart
Now I know Greg will be along soon to work his magic on the charts, in the way that he does but I often start by simply letting the price show me where the levels are. We're still trading between the big figures and that's still the main guide. 1.2400 was resistance right after the first move then it was support, now it's resistance again. 1.2350 was support at the start, then it was support after the latest 1.24 failure, then is was resistance after the last move towards 1.23. You get the picture.
What we are seeing that is important is that there's more supply coming into the market ahead of the big figures. the 20's and the 80's often play a part around big figures. 1.2225 protected 1.2200 not long ago. 1.2320 protected 1.2300 not 30 minutes ago, 1.2375/80 has played resistance.
Again, all these moves help to build up what will become your support and resistance levels to trade. Don't trust your life on them but if you're stepping in to trade, these are the types of levels and price action you need to watch so you know where the waters are relatively safest to step into.

