
Mixed on the day
EURUSD.
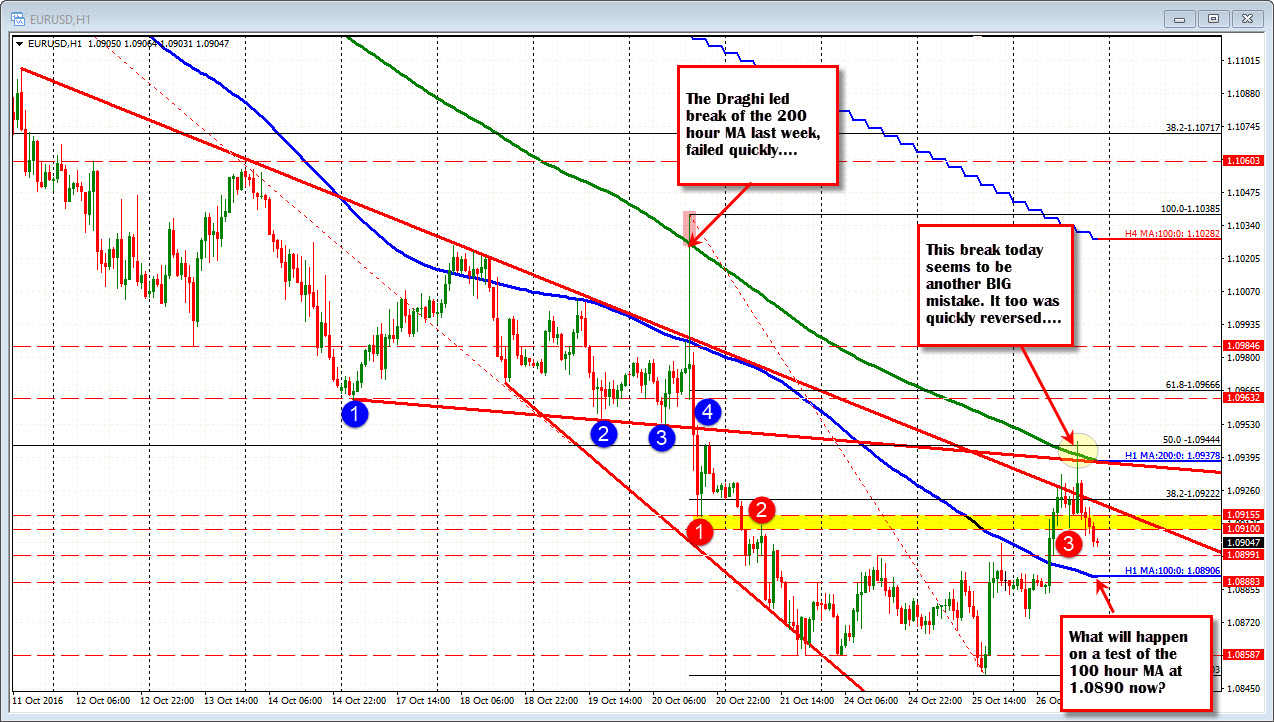
The EURUSD rallied in the early NY session and that rally saw the price move above the 200 hour moving average (green line in the chart above - currently at 1.09378). That was the first breach of that MA since last Thursday's quick break on ECB Draghi's press conference comments. The pair also tested the 50% of the move down from the same Draghi Day high (at 1.0944). That break FAILED.
The pair has since drifted back below the 1.0910 level (was low price going back to June 2016). We trade right around that level as the day draws to a close.
What next?
Well, before the rally to the 200 hour MA, the market price broke above the 100 hour MA (blue line at 1.0890) earlier in the day. That break helped propel the pair toward the next target above (i.e., the 200 hour MA, trend line and 50% level). When the pair gets stuck between the 100 and 200 hour MA, I like to say the pair is trading between the goal posts. The action was move bullish but only to a limit. At some point the market will either make a break above the 200 hour MA above, or below the 100 hour MA below.
As a result, into the new day keep an eye back on the 100 hour MA (at 1.0890 level) for support buyers. If there is a break, look for momentum. If momentum is not there, do not be surprised to see the up and down continue and a new test of the 200 hour MA as time goes by.
GBPUSD
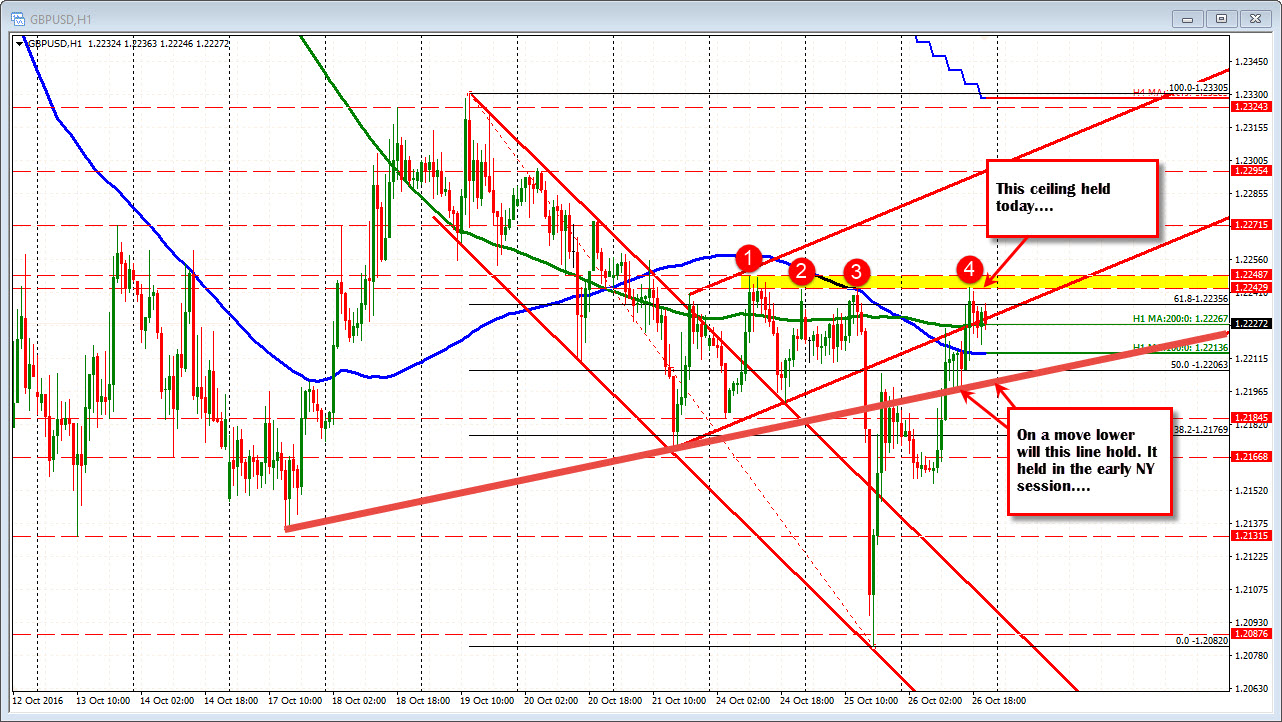
A little over a day ago, the GBPUSD was tumbling lower. New lows post the crash were made but a support trend line was being tested. That trend line held at 1.2082, and a move back higher started.
Today, that rally continued until the high from yesterday was tested at 1.2243. That stalled the rally and the last 4 hours has been trading in a 25 pip high to low trading range - above and below the 200 hour MA (green line in the chart above).
The buyers seem to holding their own at the highs. Indeed the price found sellers at the ceiling. However, the correction has stayed above the 100 hour MA (blue line) and also the thick Red line on the chart above. That line (which was a support line yesterday before the break), was re-established as support in the NY morning session (it is currently at 1.2200).
So the ceiling is in place. If we are going higher, the price needs to get and stay above that ceiling. On the downside, if we fo wander lower - and the sellers from above are rewarded - do buyers come in against that support trend line again?
We are in the middle of the range, and that often means traders will have a battle as to whether we go higher or lower from here. The battle lines are drawn. Who will dominate the next move?
USDJPY
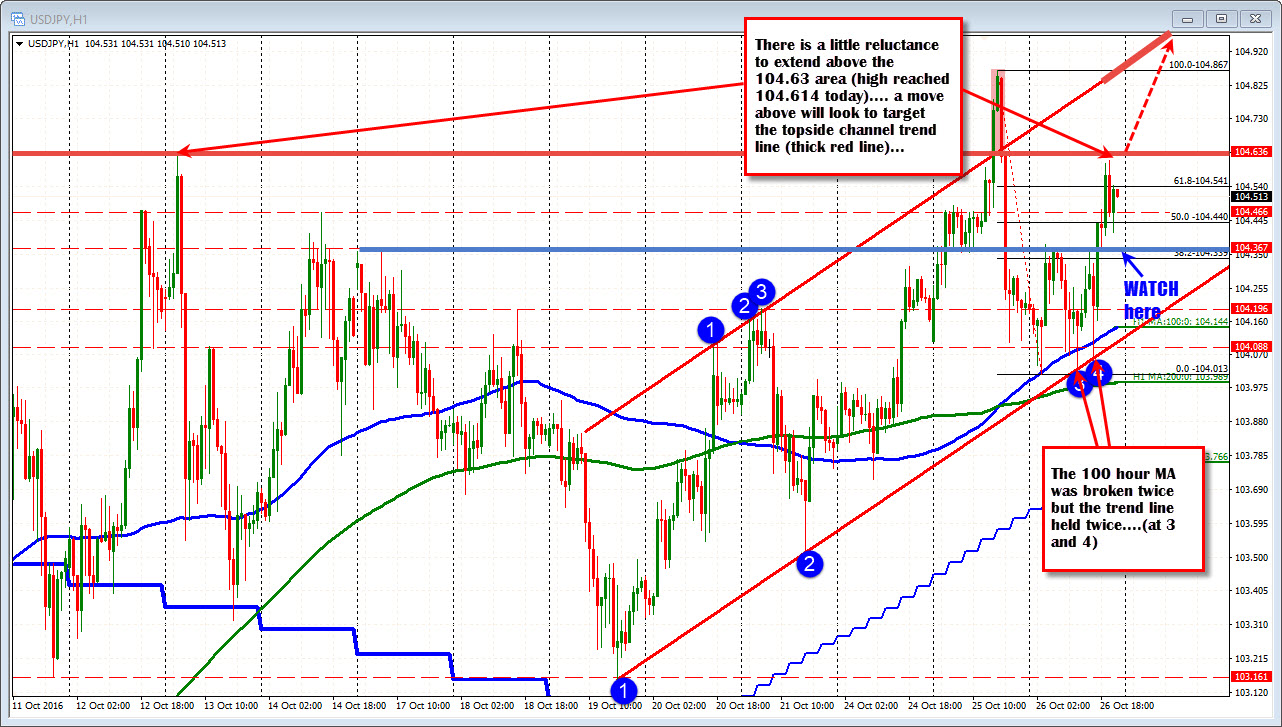
Today, the USDJPY fell below the 100 hour MA twice but held trend line support twice (see chart above). The matching topside channel trend line is higher from current levels(near the highs from yesterday currently). The high today, stalled near the high from October 13 at 104.63 (the high reached and 104.61). The price currently trades around 104.50.
In the new day watch the 104.36 on a correction lower (blue horizontal line). That was a high from October 17. Today it was a ceiling area. Stay above would be more bullish.
The recent price history shows that when the price trades in this "elevated" area, it does not stay up for long. The market is trying to develop some value in the higher area. Admittedly, we are not racing higher, but we are also not failing and moving lower.
USDCAD
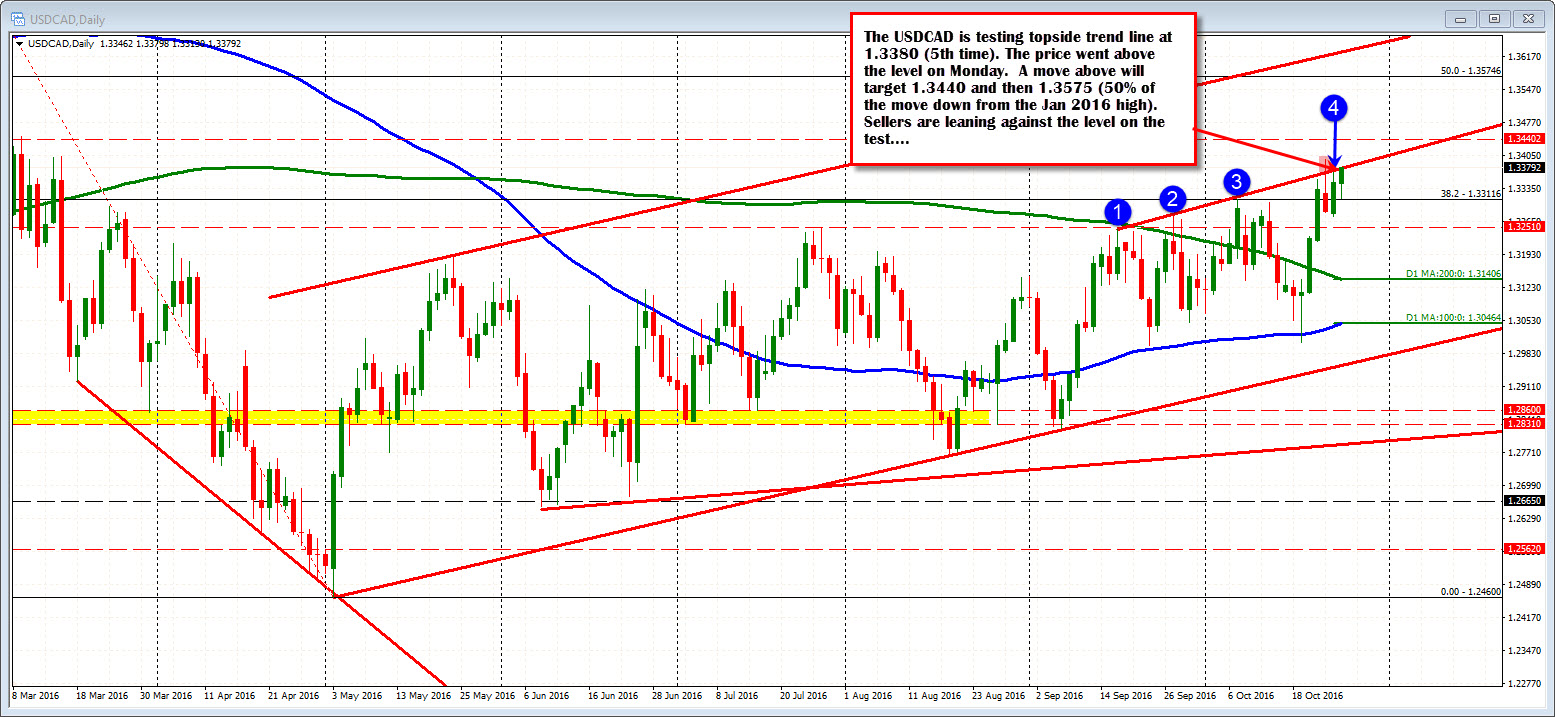
The USDCAD had a down and up day today. The low at 1.3313 came after oil inventory data came out with drawdowns of inventories across the board. However, support came in against the 38.2% of the 2016 range (from the Jan 2016 high) and the 100 hour MA (not shown but it bounced off the level). The price has rotated higher and trades near the high for the day.
That high is a key level. It represents a topside trend line on the daily chart. Yesterday that line was tested. On Monday, it was broken but failed. Today is the 5th point on the chart. Key test. A move above (and staying above) will next target 1.3400, 1.3440 and then the 50% of the 2016 range at at 1.3574. Hold below the line - or break and fail - and the 1.3311 level will be eyed as the key support. A move below and we may see an unraveling of the recent gains.
NZDUSD
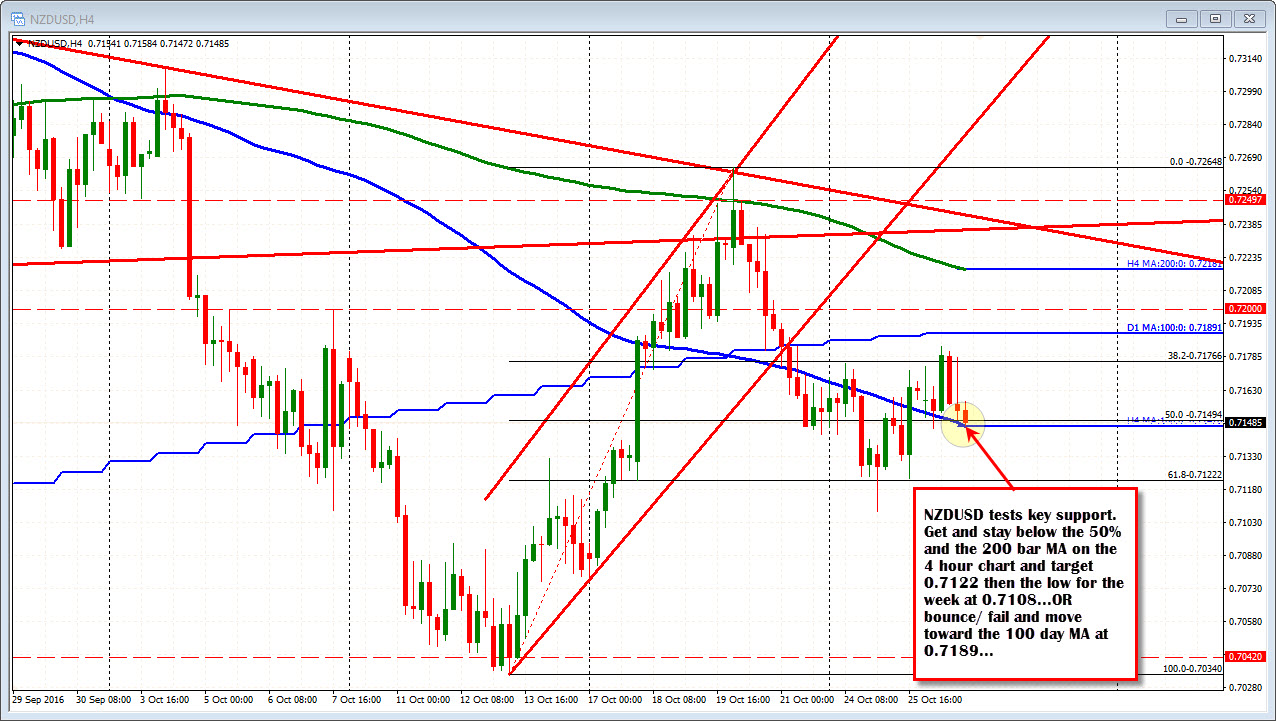
The NZDUSD is testing key support at 0.7148/49. The level equals the 50% and the 100 bar MA on the 4-hour chart. Break below and look toward 0.7122 and 0.7108 lows for the week. Bounce (or fail on a break) and the 100 day MA at 0.7189 will become a focus again.

