
Stepping to the downside with minimal corrective action
The USDJPY has trended to the downside today, cracking through technical levels in the process and with minimal corrective action.
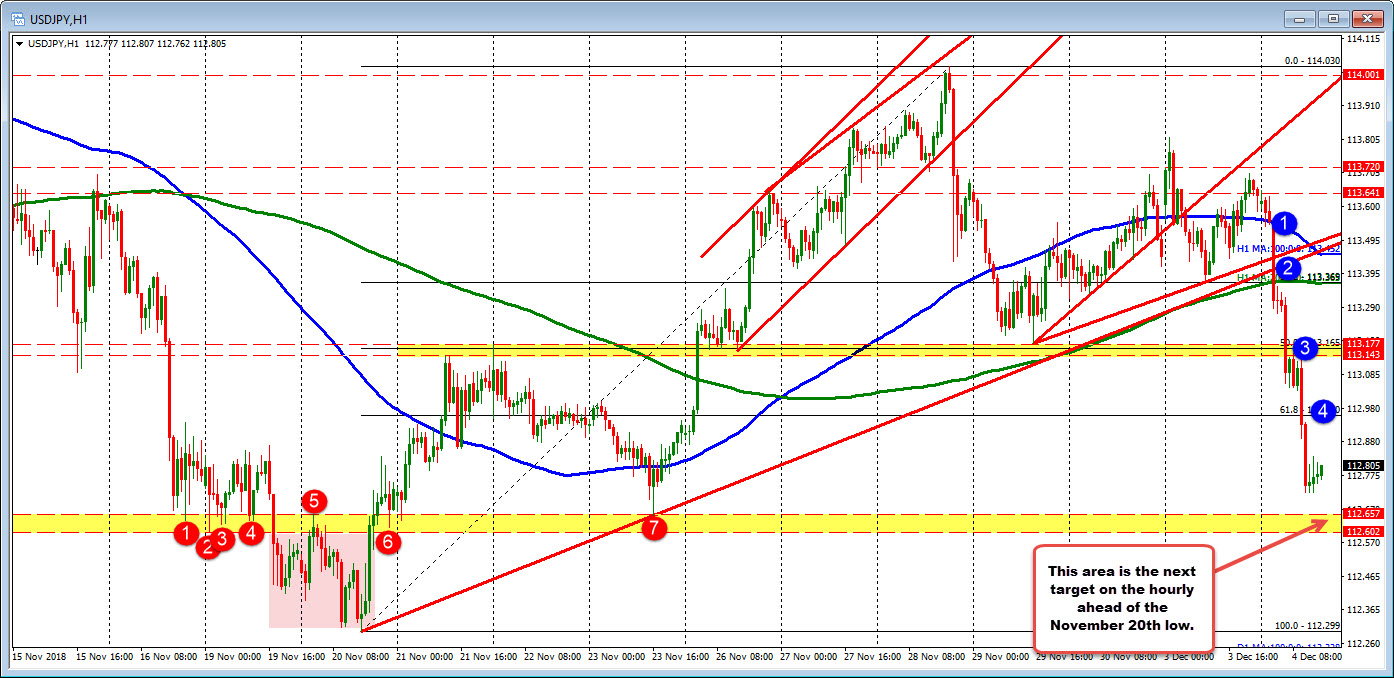
In the process, the price fell below (see blue circles in the chart above:
- 100 hour MA (blue line in the chart above - currently at 113.45)
- Trend lines, 200 hour MA and 38.2% at the 113.369-113.44
- 50% and consolidation area at the 113.14-177
- 61.8% at 112.96
The next target on the hourly comes in at the 112.602-657. That comes from the swings lows and highs before and after the November low at 112.299 (on November 20). When a market bottoms, often there is a run to a low from what seems like a base (see 1-4 red circles). That run low (shaded red area) is often followed by a move back above and a retest of the prior swing area (red circles 6 and 7) before taking off (if it is a bottom). We head back toward that bottom now.
Drilling to the 5-minute chart, the price is trying to correct off the lows now and looks toward a test of the 100 bar MA at 112.907. A move above, muddies the waters a bit for what has been a trend move lower. The 50% of the last leg lower is at 112.938. Often on a trend move lower, the price corrections will find sellers in the 38.2-50% area of the last leg lower. The 100 bar MA sits between that area (see yellow area).


