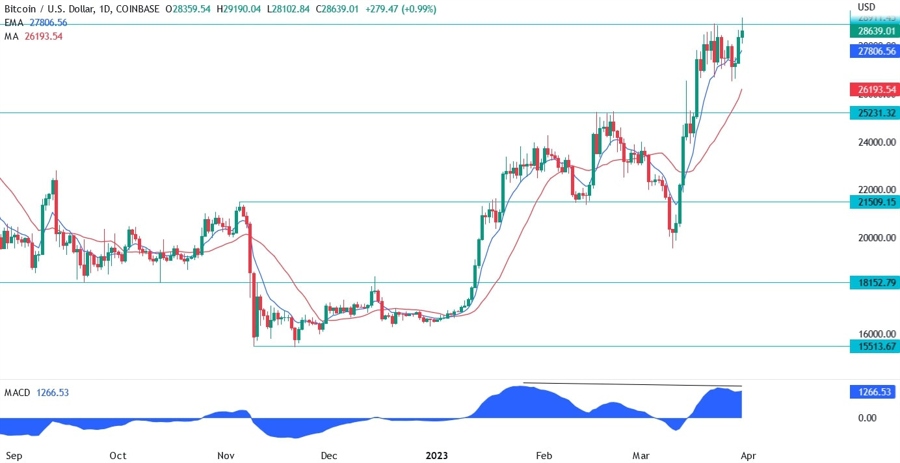
On the daily chart below, we can see that BTCUSD has failed to break a strong weekly support now turned resistance on the first try and has rallied back up again to try another shot. The buyers keep finding strong sellers there, and it looks like they will need a strong fundamental catalyst to gain the necessary momentum to breakout.
We can see that there’s a big divergence with the MACD and it’s another bad omen for the buyers in case the sellers take control. Everything will most likely depend on the evolution of the US economic data. As long as that remain strong, Bitcoin will struggle to make new highs, but weak data, on the other hand, should favour it as the market will price rate cuts from the Fed.
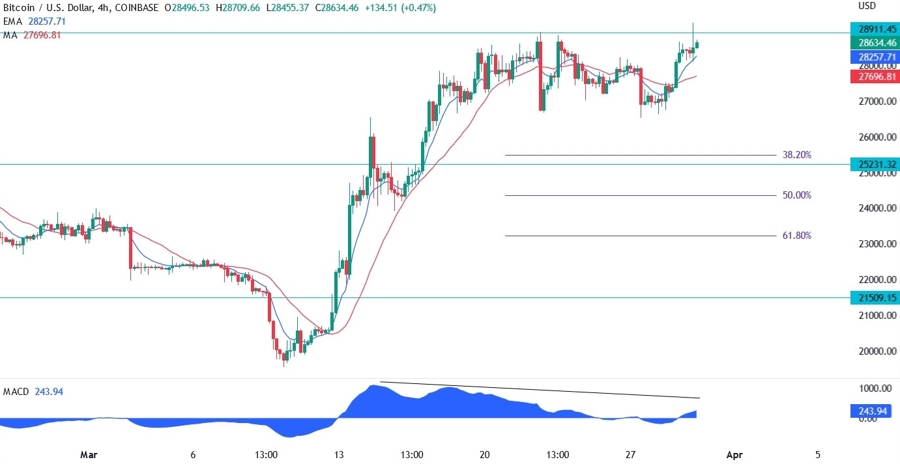
On the 4 hour chart below, we can see that we have another big divergence going on. The fact that it’s right at the key resistance makes it an even stronger sell signal but we’ll need to see how the economic data evolves to confirm the signal.
A pullback to the 38.2% Fibonacci retracement level would be a better place for the buyers to pile in and target new highs.
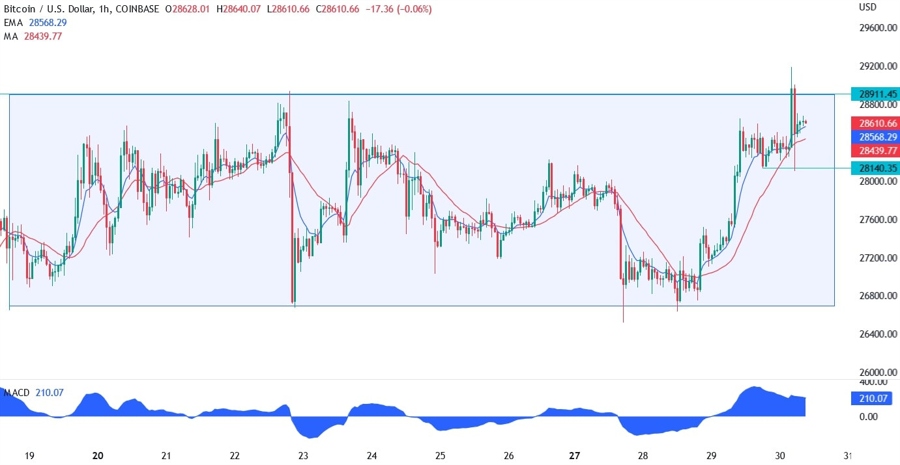
On the 1 hour chart below, we can see that the market is stuck in a range between the support at 26600 and the resistance at 28900. The best strategy here would be to sit out and wait for a clear breakout supported by a fundamental catalyst, but one can also “play the range” selling at resistance and buying at support.
Conservative sellers may want to wait for a break below the 28140 support before piling in and targeting the bottom of the range. The buyers, on the other hand, may lean on that 28140 support to try a breakout.