
Despite the surging Treasury yields and a stable US Dollar, Gold continues to set new highs as the focus remains on the Middle East. In fact, if we just track the most important developments in the Middle East, we can see how Gold first gapped higher following the Hamas attack against Israel back on October the 7th. We then had another big rally into the following weekend as Israel was reportedly ready to start a ground operation in Gaza.
The waters calmed down on Monday as the expectations around the ground operation didn’t match the reality, but late Tuesday a rocket hit a hospital in Gaza killing hundreds of civilians and sparking a global outrage. Following this unfortunate event, Gold broke out of a key trendline and started another rally, eventually culminating in another spike into a key resistance following the news that the Israeli military received the green light to move into Gaza.
Gold Technical Analysis – Daily Timeframe
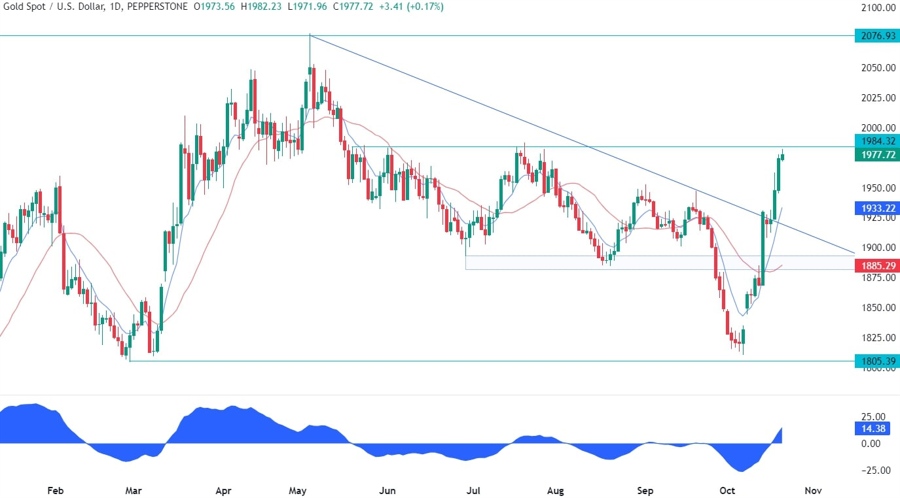
On the daily chart, we can see that Gold has reached a key resistance around the 1985 level. A break above this level would open the door for a rally into the highs. We can expect the sellers to step in here with a defined risk above the resistance to target the lows again. This incredibly strong rally is also overstretched now as depicted by the distance from the blue 8 moving average. In such instances, we can generally see a pullback into the moving average or some consolidation before the next move.
Gold Technical Analysis – 4 hour Timeframe

On the 4 hour chart, we can see that we have a good support zone around the trendline where we can also find the 38.2% Fibonacci retracement level and the red 21 moving average for confluence. This is where we can expect the buyers to step in with a defined risk below the trendline to target a break above the resistance and the all-time highs next. The sellers, on the other hand, will want to see the price breaking lower to increase the bearish bets into the lows.
Gold Technical Analysis – 1 hour Timeframe

On the 1 hour chart, we can see that we have a divergence with the MACD right at the key resistance. This is generally a sign of weakening momentum often followed by pullbacks or reversals. In this case, from a risk management perspective, the buyers would be better off to wait for a pullback into the trendline before opening new longs. The last line of defence for the buyers should be around the broken downward trendline and the 61.8% Fibonacci retracement level.

