
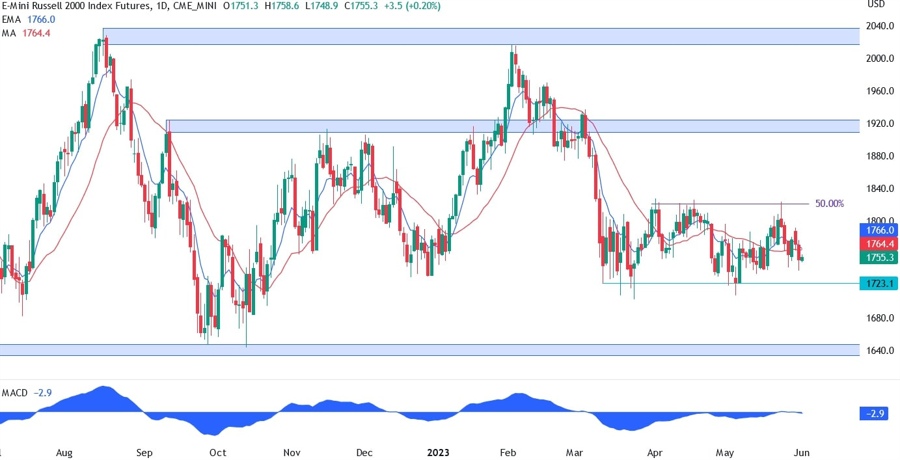
On the daily chart below, we can see that the Russell 2000 is still stuck in the range between the 1723 support and 50% Fibonacci retracement level at 1820 as resistance. These types of markets are tricky for traders as they can get chopped up within the range due to messy price action. The best strategy is usually to just sit out and wait for a clear breakout.
But one can also “play the range” by buying at support and selling at resistance, which is something that worked wonders for the Russell 2000 lately. We saw some weakness in the market in the past few days as traders were probably “selling the fact” on the debt ceiling deal. Now that we got rid of that risk, we can finally care more about the economic data going forward.
Russell 2000 Technical Analysis
On the 4 hour chart below, we can see that the Russell 2000 has bounced from a swing low support yesterday. The quick move lower was caused by a big beat in US Job Openings as the market odds for another hike in June rose to 70% in the aftermath of the release. Soon after though, some Fed officials hinted to a pause in June to buy time to see more data and the Russell 2000 erased the losses from the prior report.
Today, we have the US Jobless Claims and the ISM Manufacturing PMI, but given the Fed members’ comments yesterday, good data may not cause big moves as the NFP report tomorrow and CPI next week will be the decision makers. Bad data though may be both good and bad depending on what the market cares more about. If it’s about less hikes, we should see a rally, but if it’s about the recession, then we should see a selloff. The technicals in this case will be helpful to determine where the market wants to go.

On the 1 hour chart below, we can see that the Russell 2000 price action recently has been pretty clean with the market respecting the support and resistance levels perfectly. The bounce from the Fed officials’ comments is approaching the 1759 resistance. That’s where we can expect the sellers to pile in and target the 1723 support next. The buyers, on the other hand, will want to see the price to break above the level to jump onboard and target first the 1775 resistance, and upon another breakout, the 1791 level.

Tomorrow, all eyes will be on the US NFP report. Good data accompanied by a beat in average hourly earnings should weaken the Russell 2000 as the market might start to be concerned about a wage price spiral. Good data with a miss in average hourly earnings should be the best-case scenario for the Russell 2000 and take it to new highs.
Bad data should be just bad, but it wouldn’t be the first time that we see the market rally on less rates hikes hopes and ignoring the deterioration in the data, so keep an eye on the technicals to help you navigate the price action.

