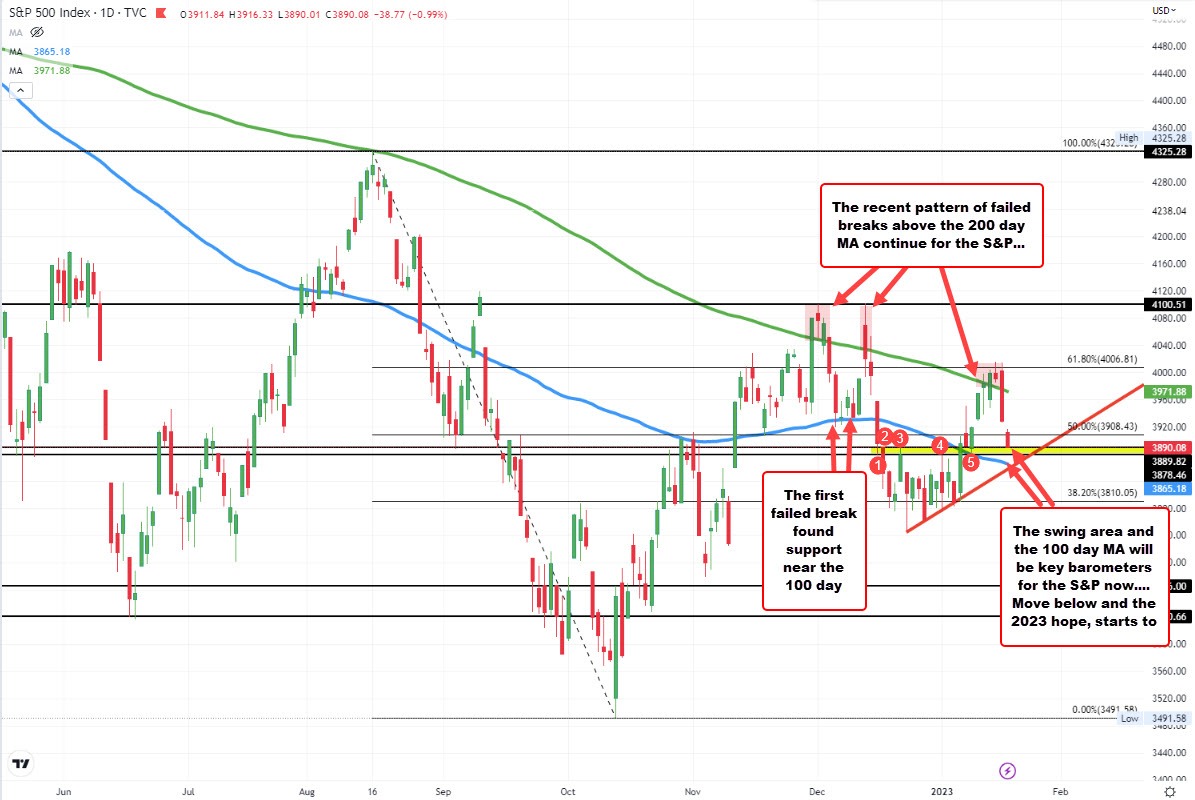
The S&P index moved down toward the high of a recent swing area between 3878.46 and 3889.82 (see red numbered circles on the daily chart above). The low price just reached 3888.39. The current price trades at 3892.79.
Below that swing area is the falling 100 day moving average which currently comes in at 3865.18 (blue line in the chart above).
Both those areas are key for the broader stock index. Move below and the 2023 hope starts to get tarnished (even more).
Just yesterday, the price was above it 200 day moving average at 3971.88. The price had closed above that moving average for three consecutive days, which gave traders hope that 2023 would be a nice bounce back.
However after the price fell back below that 200 day moving average (held by weak data including retail sales, industrial production), buyers turn to sellers.
That same pattern happened in December on two separate occasions. The first failed break above the 200 day moving average found support buyers back near the 100 hour moving average (blue line). The second failed break, however, found sellers through the 100 day moving average with the price extending to a low of 3764 reached on December 22 before the market bottomed and started its early 2023 run higher.
What might happen on a retest of the 100 day moving average this time? Will buyers come in ahead of that level near the swing area?
Ultimately if the buyers are to take more control, getting and staying above the 200 day moving average is required. The good news is with the moving average continuing to slope to the downside, the hurdle is more doable than it was yesterday (and last month, etc.), but the fundamentals of a weaker economy /lower earnings still looms.
/Inflation


