The major US stock indices are moving higher taking their clue from lower yields. The 10 year yield is now down around -4 basis points or 3.718%. The two year yield is also lower by -3.6 basis points at 4.481%. The weaker than expected S&P global PMI manufacturing and services indices are the catalyst for the decline in yields.
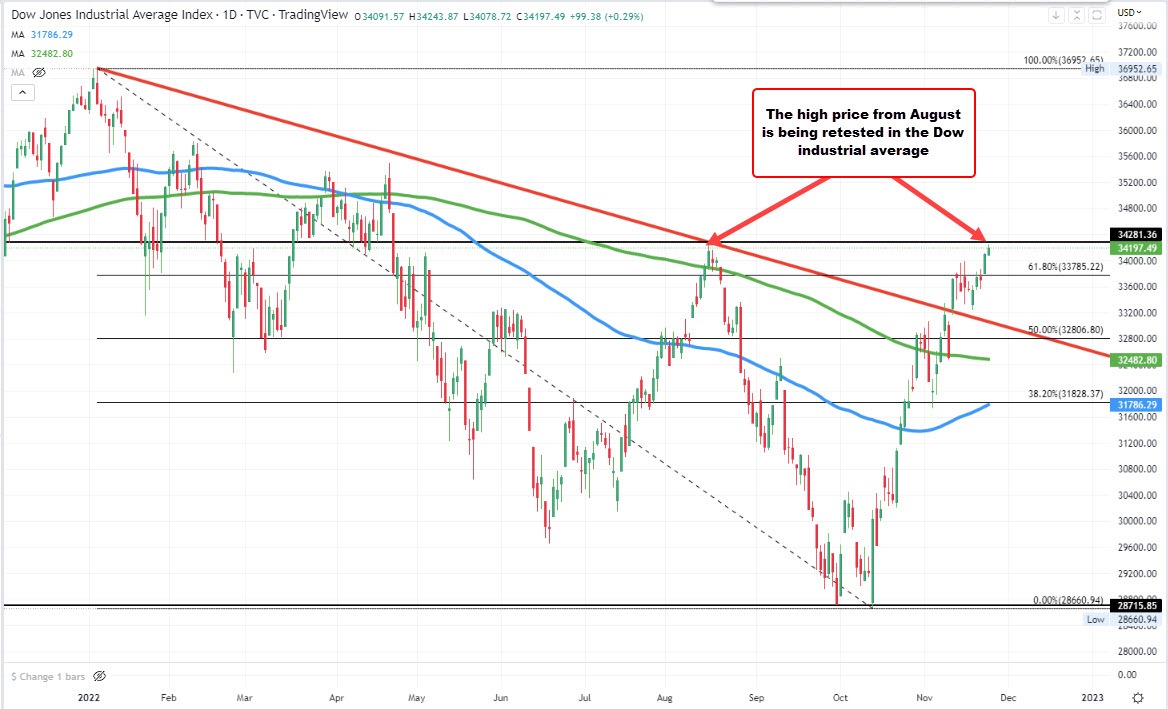
The Dow industrial average reached a high of 34243.87. It is just short of the August high of 34281.36. The Dow has come off that high and currently trades at 34185 up 87 points or 0.26%.

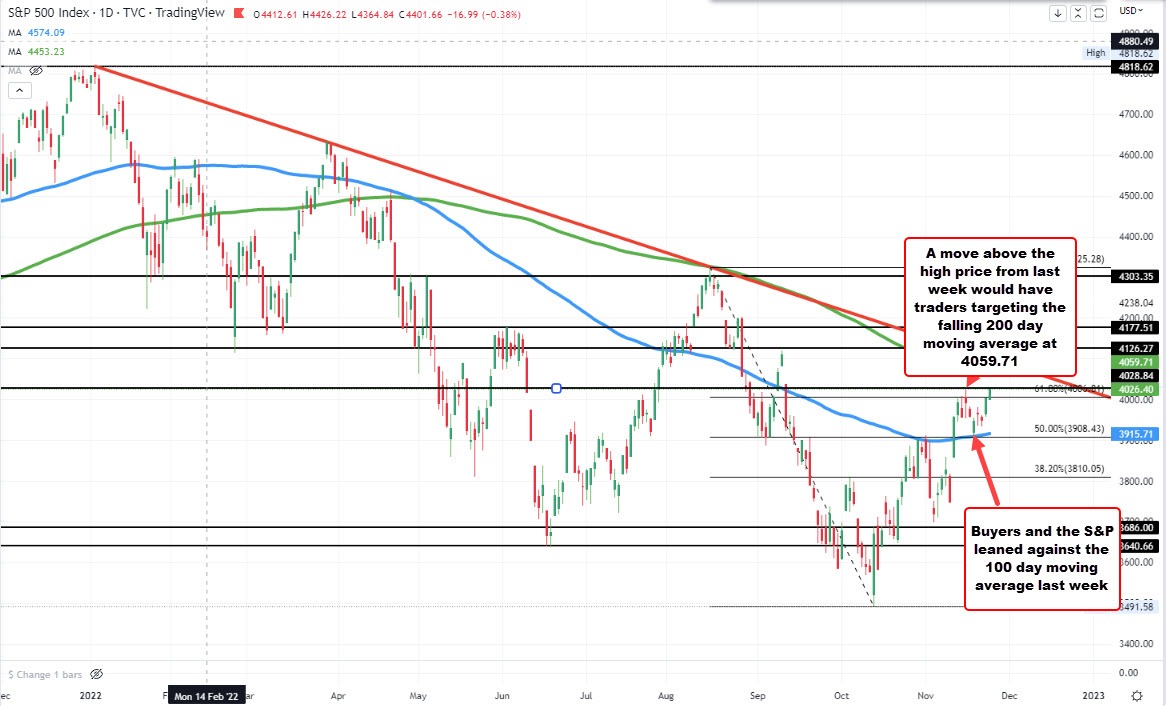
The S&P index is currently up 22 points at 4025.78. The high price reached 4027.16. That was just short of the high price from last week at 4028.84. Move above that level would have traders looking toward the 200 day moving average at 4059.71. Recall back in August, the price tested that moving average and found willing sellers. Admittedly the moving average was much higher at the time with the 200 hour moving average at 4226.18. The hurdle now is much easier. Last week the low price stalled just ahead of its 100 day moving average given the buyers the go-ahead to push higher (see blue line in the chart below). Buyers remain in control on the daily chart.

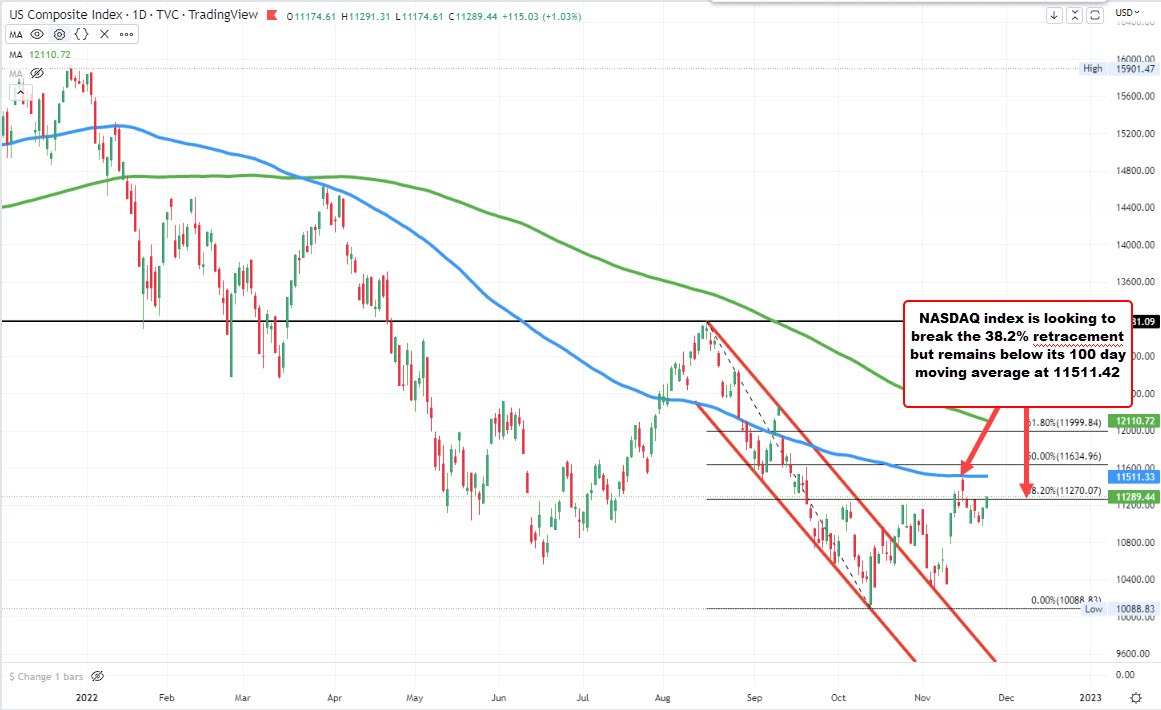
The NASDAQ index is lagging the Dow and the S&P to the upside. It still remains well below its 100 day moving average at 11511.31 and below the high price from last week which extended up to 11492.62 before rotating back to the downside. On the positive side the price is moving above the 38.2% retracement of the move down from the August high. That level comes in at 11270.07.


