The USDJPY has moved higher for 6 consecutive days. The move took the price from 114.80 to the high today at 118.44. The price yesterday closed at 118.20. The low price today reached 116.688. The current price is at 118.00.
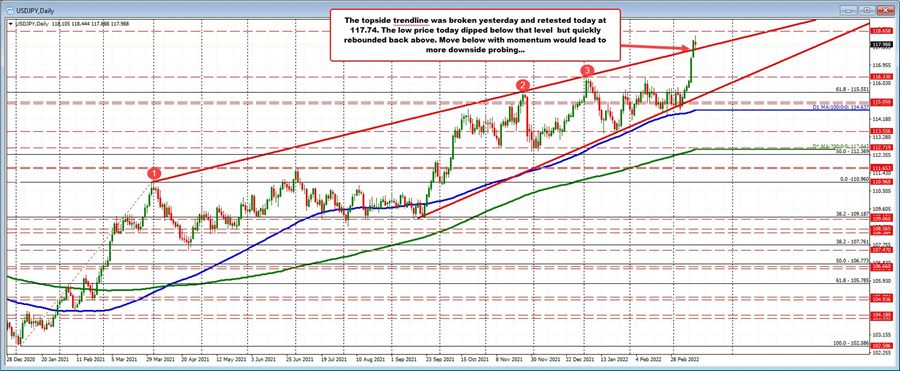
Looking at the daily chart, the move to the upside yesterday broke above a topside trendline connecting highs going back to the end of March, November, and early January. The underside of that trendline cuts across at 117.74. The low price today did dipped below that level but has quickly rebounded.
Watch the 117.74 level going forward. A move below with momentum should see a corrective probing to the downside.
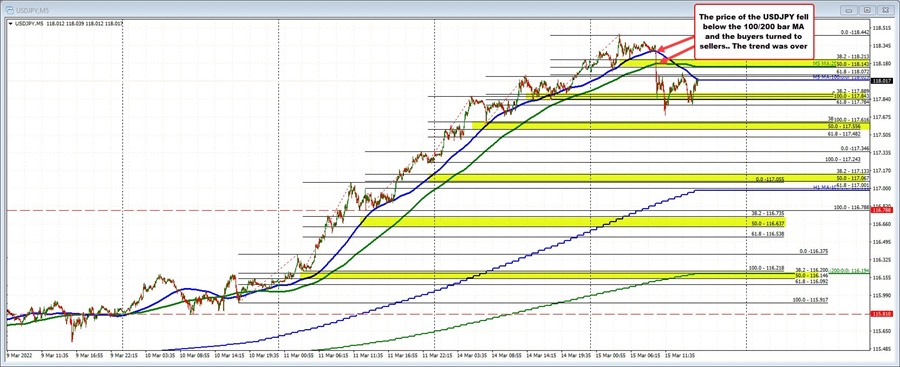
Drilling down to the five minute chart, recall from a post yesterday, the pair had been stepping higher in a trend like fashion. The price action yesterday held support near its 50% midpoint of the last leg higher (follow the yellow areas on the chart below), and extended to a new high at the close. That momentum continued into the new trading day with the 100 bar moving average holding support as the price rose to the new cycle high at 118.44.
However, the 100 bar moving average (blue line) was finally broken with momentum, as was the 200 bar moving average (green line), and the buyers turned to sellers pushing the price down to the low for the day at 117.688.
Since then, the price has seen a rebound and is currently up retesting it's broken 100 bar moving average. A move above it and the 200 bar moving average at 118.14 (green line in the chart below), would give buyers more hope. Stay below and the short term bias is still corrective to the downside for the USDJPY.