What does the Fed fund futures curve really imply?
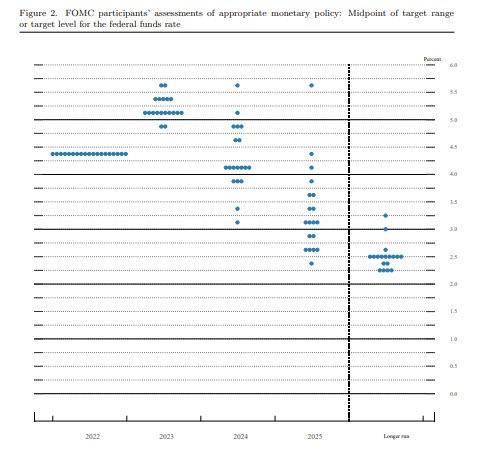
Right now it shows rates at 4.44% at year end. That's far from the 5.00-5.25% that the Fed is forecasting via the dot plot but be careful as interpreting that as the market thinking the Fed will start cutting.
The 4.44% rate at year end is a probability-weighted number and shows the pitfalls of assuming that market participants have settled on a single number. Instead, think of it as the intersection of a range of possibilities.
To the upside, there is the dot plot top of 5.75%, where two FOMC members pegged it.

The downside is where it gets interesting. There isn't a great scope for a slow decline to 4.44% or thereabouts. Instead, what the market is saying is that there's a decent probability of a hard landing recession or some other kind of event that causes the Fed to cut rapidly.
You might price that as a 20% scenario where the Fed cuts to 3.00%. In addition, there's always the risk (maybe 2%) of a pandemic-style crisis, war or political disaster that causes the Fed to cut back to 0%.
These are just back-of-the-envelop numbers but they paint of picture of how the market comes to a probability-weighted number of 4.44% without that being a forecast.
At the same time, if rates end up at 5.00% at year-end, that isn't necessarily bearish for risk assets and bullish for the dollar. It means that the tail risks around US and global growth didn't materialize and that some stability has been achieved.
Where the Fed funds futures market is more-literal is the near term. The Feb 1 meeting is just three weeks away so the tail risks between then and now are negligible. The main visible risk is Thursday's US CPI report and I would expect to see some swings in probabilities based on it. But for now, the market is pricing in a 75% probability of a 25 bps hike with the remainder on a larger 50 bps hike.


