
How to use divergences to your advantage

This article is devoted to a famous tech analysis instrument, which is divergence. Regardless of being so well-known and popular among traders, divergences brought a lot of people to a lamentable state. I think, this is because a lot of traders who had a bad experience with divergences in Forex, futures, or stock markets, used it for catching reversals. And hunting reversals with any type of tech analysis is quite tricky. That is why we will step aside from this dubious topic and concentrate on trading the trend.
Indicators for catching divergences by trend
Open and AUD/USD chart and install to it two most popular indicators for finding divergences - the MACD and Stochastic. I compared their efficacy in the same market situation and, honestly, Stochastic is no worse than the MACD for catching divergences; on the contrary, sometimes it even does a better job. Hence, for determining divergences in uptrends and downtrends, we will use the Stochastic Oscillator.
Let us leave the parameters standard for neither you not me to get confused. There is no need changing things that work pretty well. As long as the indicator looks like two lines, I will mention it separately that I draw a divergence through the highest tops/deepest bottoms regardless of the line that forms them.
A signal to buy from a divergence by trend
In an uptrend, when a divergence by the trend forms, a signal to buy will appear if:
- The second local low of the two necessary for a divergence by the trend is complete;
- The second local low of the two necessary for a divergence by the trend on the Stochastic is complete as well;
- The lines drawn through the two local lows on the chart and Stochastic are converging to their right.
Judging by those divergences I managed to find in the Aussie before I started this article, it is no worth counting on entering at a better price than the one you see when the signal appears.
Sometimes the price pulls back a bit during a candlestick or two, but normally no deeper than the tip of the first low of the two that create the divergence. Hence, better enter by the market price, right after the signal appears or by a pending order at the smallest possible distance from the current price.
By the way, it is super desirable that the second extreme broke falsely through the level of the first one. If the breakaway is true, the probability that the bullish signal will work might be lower.
Examples of a signal to buy:
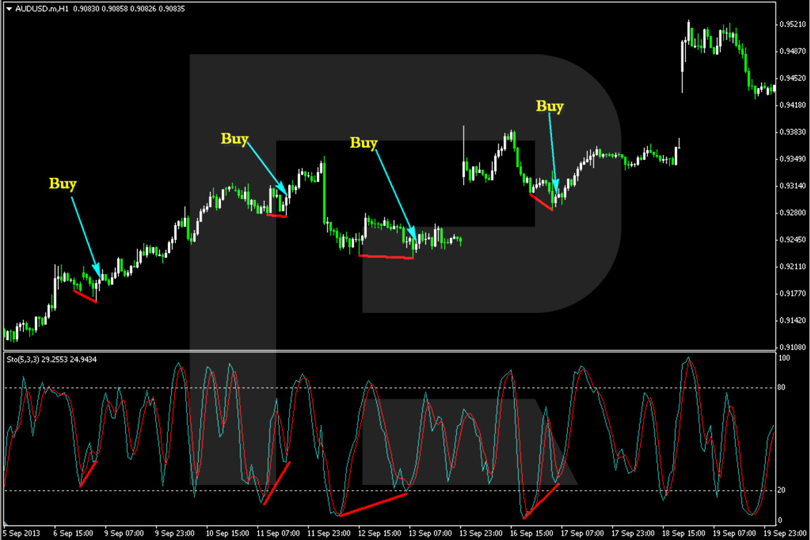
As you see, only the second entry signal by the trend to the left could lie idle, but you may transfer the position to the breakeven many times, so this signal is also considered positive.
A signal to sell from a divergence by trend
In a downtrend, with a divergence formed by the trend, a signal to sell will be a moment when:
- The second local high of the two necessary for a divergence by the trend is complete;
- The second local high of the two necessary for a divergence by the trend on the Stochastic is complete as well;
- The lines drawn through the two local highs on the chart and Stochastic are converging to their left.
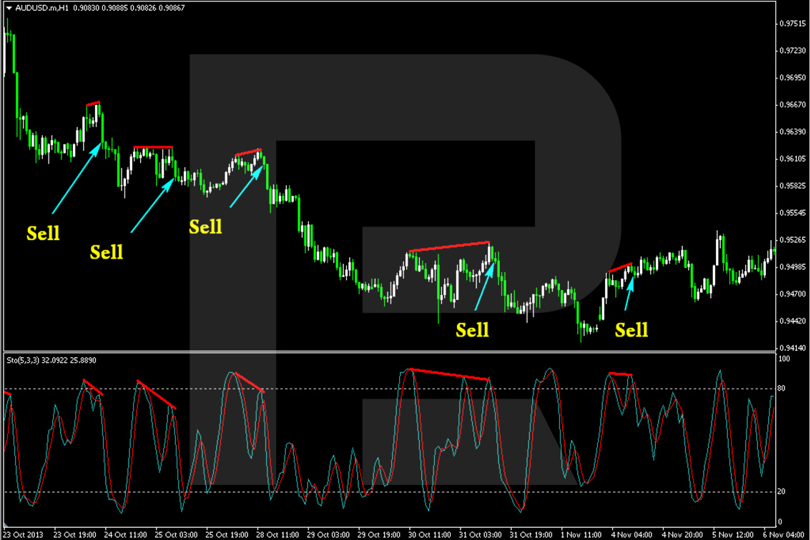
And on this part of the chart, only the last one of the divergences turns out to be 100% losing. But if you recall my advice to use only those divergences in which the second extreme breaks through the level of the first one falsely, you will not use this only losing signal on the chart because in this case, the breakaway of the first extreme was true.
Take Profit and Stop Loss
By this strategy, Stop Losses are placed above the highest high of the divergence in a bearish trend and under the lowest low of the divergence in a bullish trend. You can drag it after newly emerging extremes along with the price heading for the profit. In either trend, you should drag the SL to the breakeven using every acceptable extreme, while when the position gets protected from losses, try using only those extremes that seem to you safe from further testing. As a rule, an extreme is safer when it takes long to form.
As for the Take Profit, place it according to your experience and the market situation. If you see the trend exhausting or the market stuck at a level, these might be the moments to determine a place for your TP.
Money management
Using this strategy for the first month, never risk more than 1% of your deposit - take your time to find good and promising divergences by a bearish/bullish trend. As well as take your time to feel how the price behaves after the signal appears. When you adapt fully, you may increase your risk to 2% but never more.
To sum up, I would remind you that it is extremely vital to choose a timeframe that is good for you and not necessarily the one I am giving you examples on, or some Jack down the street recommends you. Also, you need a lot of patience if you trade in Forex or on the futures market. Well, same with stocks. Everybody knows that 70% of time the market spends in dubious flats. And the strategy requires clear uptrend and downtrends that take only 30% of trading time.
By Dmitriy Gurkovskiy, Chief Analyst at RoboForex

