Keeping your eyes wide open, can influence your bullish/bearish vision.
I look at the price action as a game, and in games there are winners and losers. For traders it is the buyers or the sellers who are the winners or losers. One is winning. One is losing
To define the victor, I apply technicals that give an unbiased opinion on who is winning.
Now, in reality most times in currencies, because it has so much history and because currency pairs go up and down as the relative economies ebb and flow (among other things of course), the price could be racing higher over the relative short term, but is still in a downward bias in the long term.

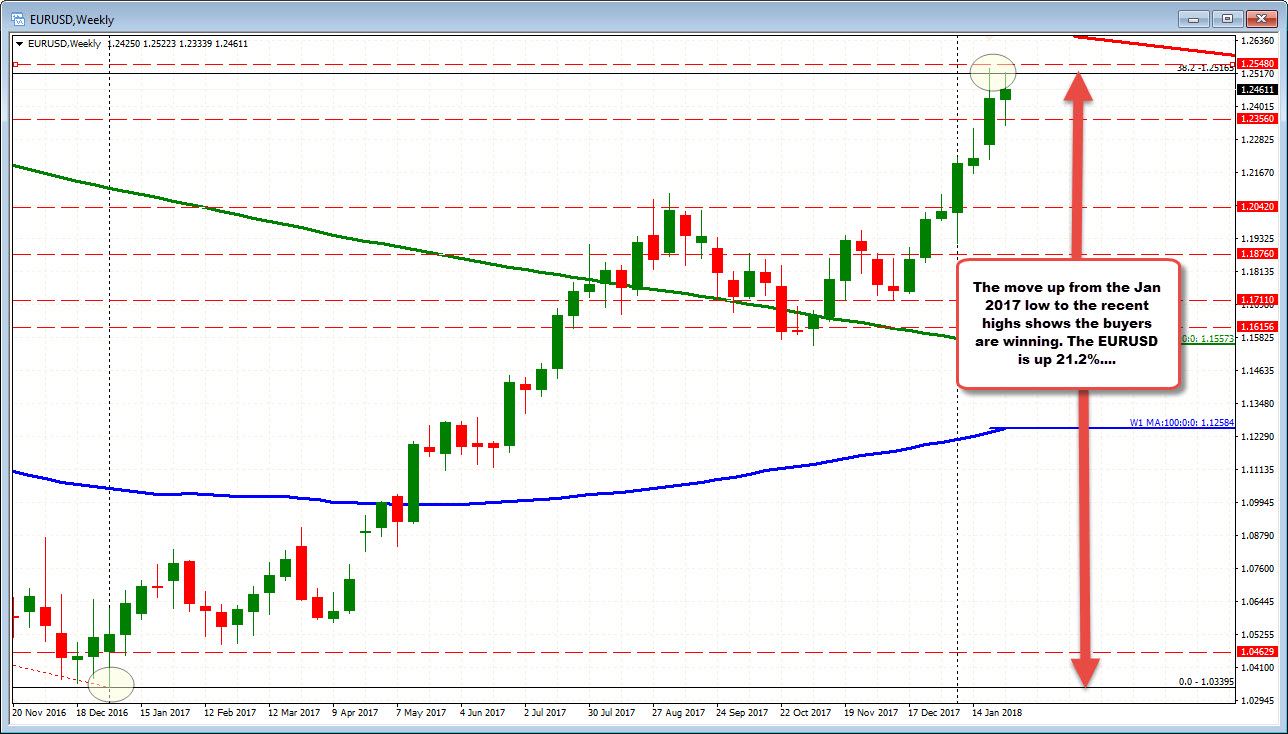
The EURUSD on the weekly chart above has moved from 1.0339 to 1.25369 since the beginning of the 2017. That is nearly 2200 pips or a 21.2% rise in the EUR/fall in the USD.
The buyers are winning.
However, if you go back to the the 2008 high (see the montly chart below), the price action is to the downside. The sellers are winning despite the 21.2% rise since January 2017.
From the high of 1.6038 to the current price of 1.24543 the EURUSD has gone down 3884 pips. That is much more than the 2200 pip rally from the low (ironically, the fall is 22.3% from the high, which is almost equal to the 21.2% rise from the low).
The sellers are winning since 2008.

For me as a trader, most of the time, I default to the more present as most traders are focused on the more recent. I will even look at the 5-minute chart if it gives me a clue as to what the traders are doing out there. In fact, a lot of intraday traders will only look at the 5-minute chart (or even a tic chart). They reason "Why do I care about a longer time period, I am trading now?"
I think that is a mistake. I think traders - if you are really doing your homework - need to have your eyes open wider - even if you are day trading.
In fact, for me, a monthly chart, can shape my intraday trading bias more than a 5-minute, hourly, daily or weekly chart.
Why?
Because while the shorter term 5- minute hourly, and daily and weekly chart since January 2017 may be saying "Buy. Buy. Buy" as the price trades higher and higher and higher (some 21% since January 2017), the longer term chart monthly chart may be saying, "CAUTION! We are approaching a key resistance level that could stall the rally".
Looking at the monthly chart above, putting a Fibonacci retracement on the move down from the 2008 high to the 2017 low, the 38.2% retracement comes in at 1.25165. In addition, if you added a 100 bar MA (in this case it would be the 100 month moving average - the blue line in the chart above), that level comes in at 1.2548 this month.
- 38.2% is at 1.25165
- 100 month MA is at 1.2548
The difference is only 32 pips. Those key technical levels are pretty close on the month chart and as a result can slow even the strong bullish markets in the shorter term.
So what happened over the last few weeks?
Well, looking at the shorter hourly chart below, the high price on January 25th stalled at 1.25369 - between the two technical levels. The price came down. The sellers - against that area - won on a trade.

This week, the high on February 1, stalled at 1.25223. Again, between the two key monthly levels. Sellers in the area, won on a trade as the price did move back to the downside.
Is it an accident the market is having some upside stall between those key technical levels from the monthly chart?
I don't think so.
Going forward, does it mean that the price will go down from here?
I am not a fortune teller (and no one is by the way) on whether the area will be the top for a while in the the EURUSD.
However, what I do know is those levels are key for the bullish/bearish trading bias. Even in intraday trades, the monthly chart can open your eyes to a pretty good trading opportunity.
So for trading next week, stay below, and the bias - despite the bullish run up - is bearish. The sellers who are leaning against the levels are winning.
Move above is "more" bullish and the buyers will be winning.
SUMMARY
Keeping your trading eyes as open as possible - even to the LONG monthly chart - can give you some low risk trading opportunities that can make you a winner in your trading and help define who is winning in the bullish and bearish bias view.
Scan those longer term charts for technical levels that can help sharpen your intraday trading vision.


