

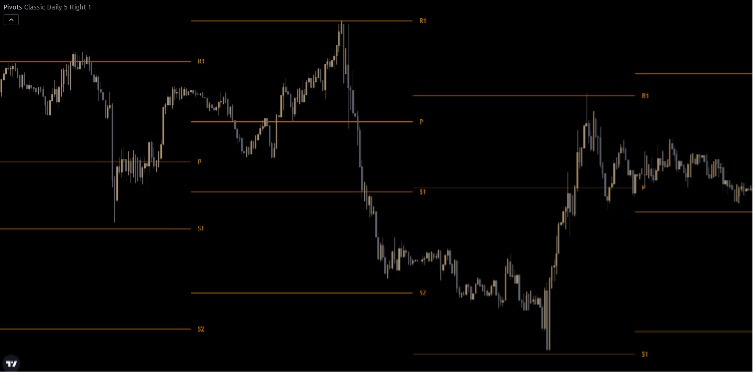
Pivot points are mostly used by day traders. It’s a technical indicator which, through a calculation of the previous day’s data like the high, the low and the closing price, displays levels on the chart that could be used as support and resistance.
Generally, you have the central pivot point (P) and then the possible resistance and support levels (R4, R3, R2, R1, S1, S2, S3, S4). Calculations can be applied also to the previous week or month’s data in which case you would have weekly and monthly pivot points, but the most used ones are the daily ones.
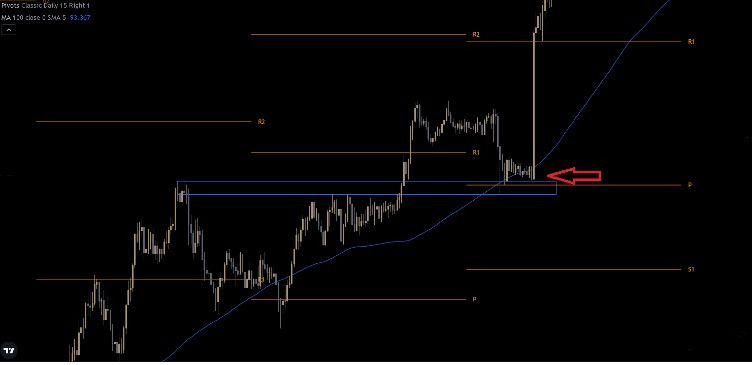
Pivot points can be used for confluence with other technical concepts or indicators to find possible tradable levels and for stop loss placement. For example, you may want to go long and see if there’s a good level of support where you can enter. You find a nice previous swing point level that is in the same area of the pivot point (P), and on top of that you also have a moving average.
So, you found this nice confluence zone and the only thing you need to do is to open your trade and place you stop loss below that area, so if the price starts to go against you, then your trade setup would be invalidated.
As always, don’t trade based solely on technical analysis but get your trade idea from fundamental analysis first. Once you have your direction, switch to the chart and start to structure your trade.
This article was written by Giuseppe Dellamotta.

