

The Average Daily Range is a technical indicator used to measure the volatility of an asset. It displays how much an instrument can move on average during a given day. It’s pretty simple to calculate: sum the values of how much an asset moved from the high to low in a day for 21 days and then divide by 21. You will get the Average Daily Range of that asset over 21 days.
Note that 21 is personal preference and you can use 5, 10 or 15 days. The 21 value though is a good overall period because too short of a period can include short-term noise and too long of a period can exclude some new development in the markets.
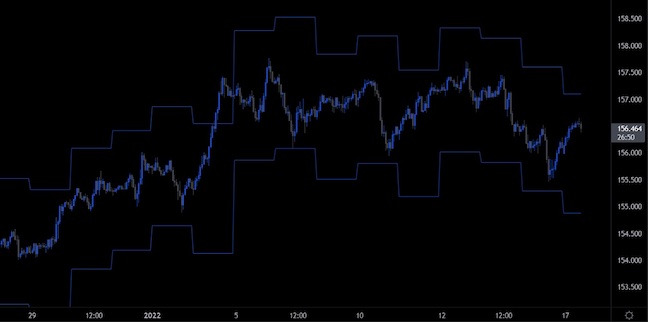
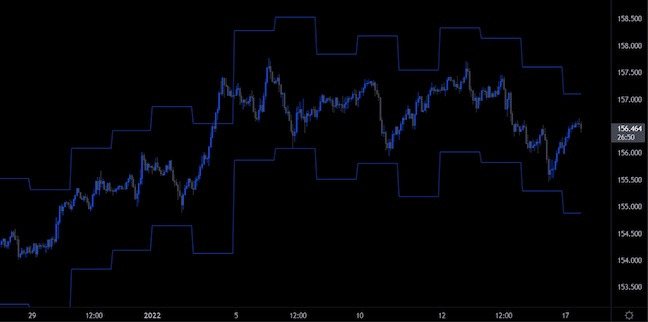
You don’t need to calculate the values by yourself as there are technical indicators doing that automatically for you. Below you can see a chart of GBP/JPY displaying the latest average daily range over a 21 period, which is 110 pips. That means that GBP/JPY can move on average 110 pips on any given day.
The ADR can help you with stop loss placement. Many novice traders struggle with stop losses as they get stopped out frequently because they set tight stops. If you have an asset that moves on average 110 pips, then setting a tight stop like 20 pips is counterproductive because it increases your chances of being stopped out prematurely.
For an even better stop loss placement you can combine the ADR with technical levels like swing highs/lows or some confluence of other technical concepts like support and resistance, Fibonacci levels or trendlines.
This little tip can help you with your risk management, especially for swing trades, and possibly increase your chances of success.
This article was written by Giuseppe Dellamotta.

