
The aussie is the weakest major currency on the day and charts are pointing to further downside
AUD/USD has been tearing it up as it made its way higher since December last year. But the main reason for that is that buyers have always found a way to lean on key support levels - particularly on the hourly chart - for a bounce higher.
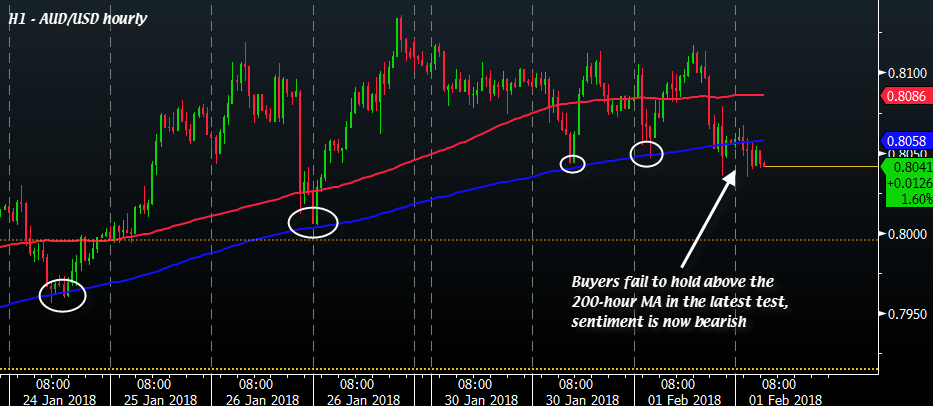
Today, we're starting to see some tell tale signs of exhaustion. On the hourly chart, buyers are failing to hold the price above the 200-hour MA in the latest test - and that is a sign that is hard to ignore. Buyers have previously held onto said level multiple times over the last week (circled areas).
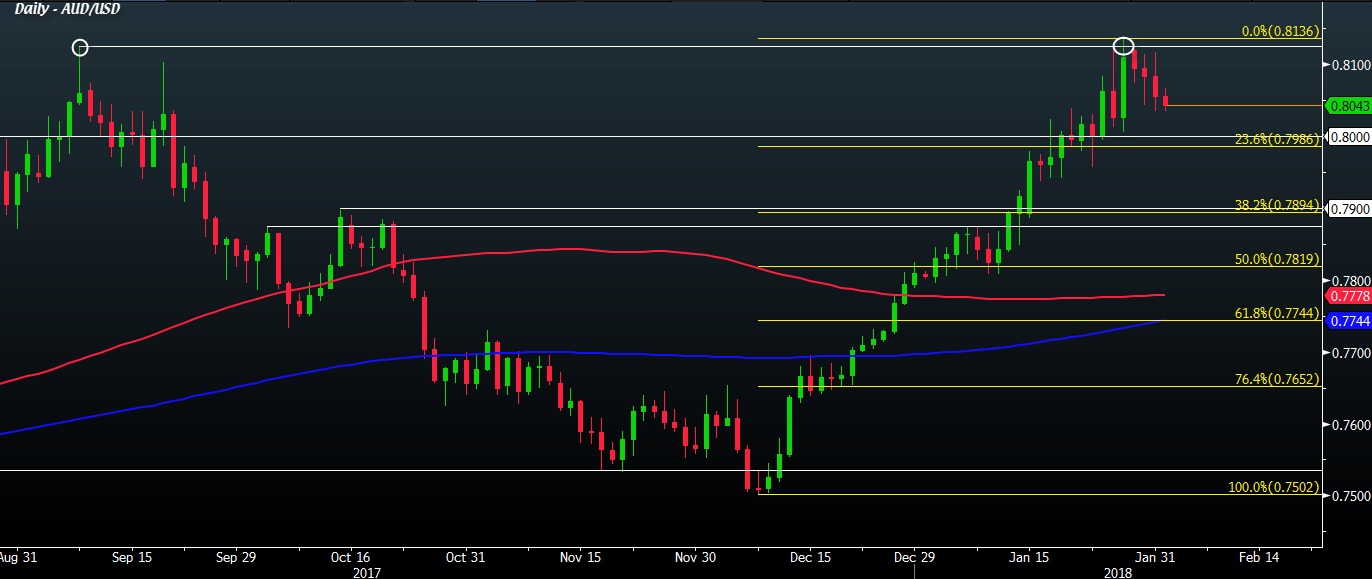
The daily chart also tells another story that we may have just found a top in the pair. The recent high was rejected similarly as it did back in September and it's a sort of double-top formation which points to a move towards the downside. And if you include today, it will be four consecutive days of declines for the pair - last seen back in November.
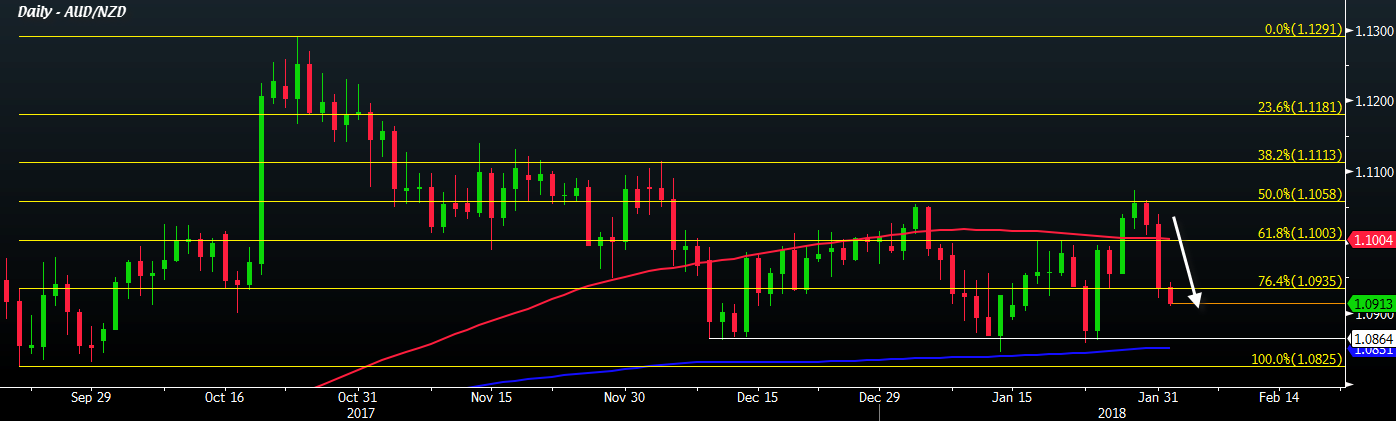
Even on the AUD/NZD chart, things does not bode well for the aussie. The daily chart shows that the recent downtrend still has room to go further still - likely towards the support level at 1.0864.
Join the conversation in our new Telegram group.

