100 day MA behind
The EURUSD bounced higher from the earlier post, but kept under of the closing level from Friday near the 1.1200 level (the high stalled at 1.1189). The move lower has the pair looking back toward the trend line support on the hourly chart at the 1.1137. Below that remains the 100 hour MA at 1.1129 (blue line in the chart below). The 50% of the move up from the April 28 low, comes in at 1.11214. The low today came in at 1.1122. The story from earlier today remains the same with the exception the support moves higher with the slope of the trend line and MA line.

Are there any other short term clues?
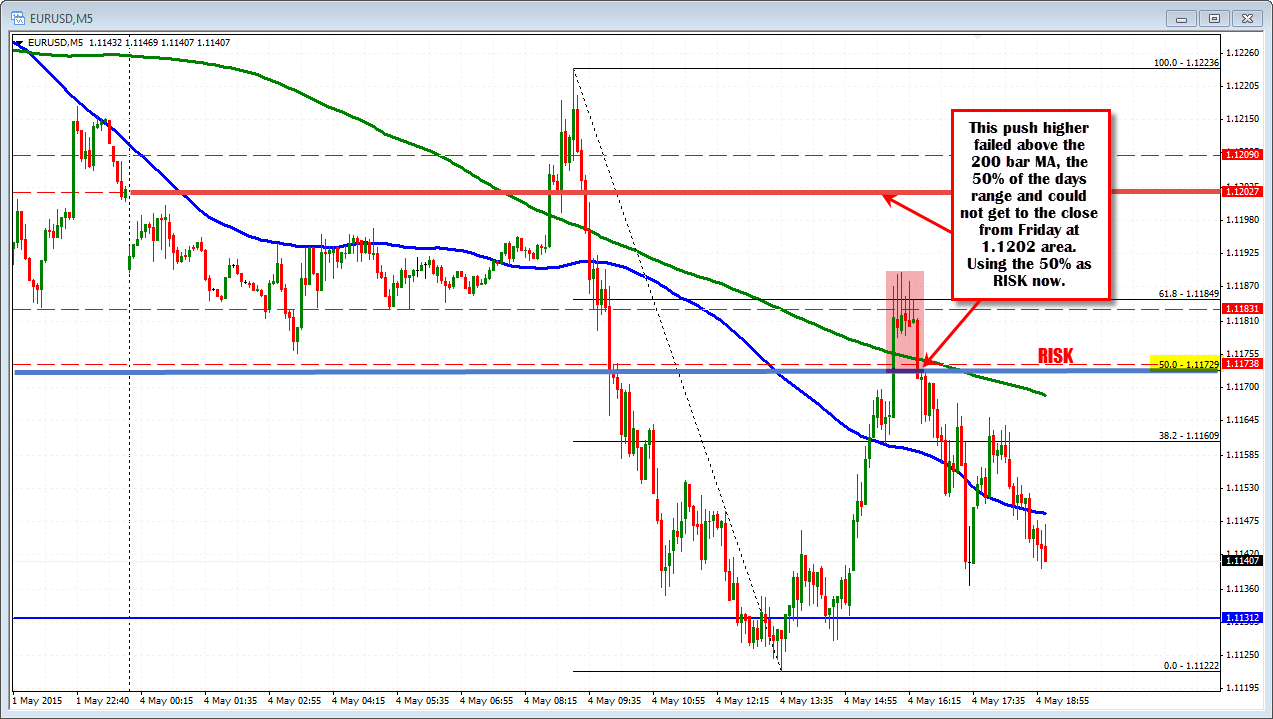
We know the short term sentiment shifted to more bearish after the price peaked near the 100 day MA on Friday (see education video on sentiment by clicking HERE). That sentiment shift still has some work to do to continue the rotation lower. Getting below the levels outlined should open up the downside to more momentum. The pairs peak in the NY session did hold the topside trend line. Looking at the 5 minute chart below, the rally surged above the 50% of the days range, plateaued and then fell back below the 50% level. So I give the sellers more control below the 50% level (risk at 1.11729). I would expect that the sellers would lean against this area on rallies.


