The EURUSD rallied on what was some pretty yucky numbers from the US.
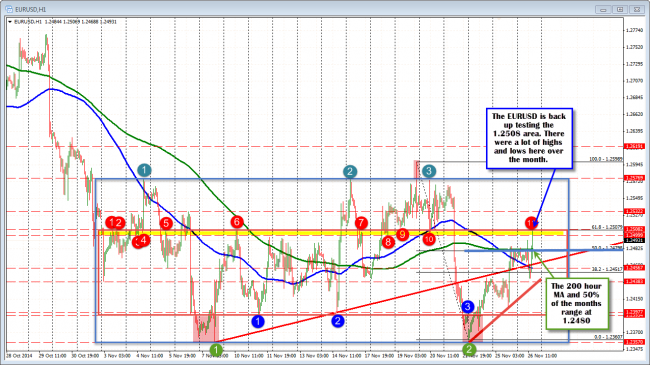
The pair moved above the 50% of the November up and down trading range and the 200 hour MA (green line) at the 1.2480 area (see chart below). The peak came in at the 1.2507. Looking at the hourly chart below, this is the topside of what was the “red box” talked about all last week (remember that?). The 1.24995 level was also the low price going back to October 3rd (after the September plunge). Since peaking there, the price has fallen back off and tests the 200 hour MA and 50% at the 1.2480 (low at 1.2483). With more data at 9:45 AM and 10 AM and the holiday exodus after, the activity is anyone’s guess.

EURUSD back up testing the 1.2500-1.2508 area.
November has been an up and down month and despite the choppiness, there has been some technical clues from the charts that have held up. I would think that going forward taking clues from the “levels” is the best course of action. It can bite you in the butt if you ying when you should yang and some fundamentals may solicit the expected reaction. Other times, you may scratch your head. However, if you can find the right level, lean against it. Be disciplined. You should be able to keep your nose from getting too bloody.


