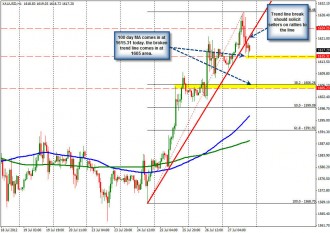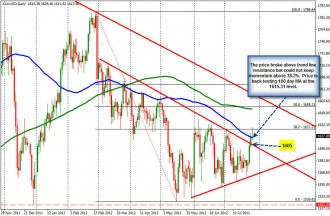
Gold tested and moved above the 38.2% today, but has rotated back lower as there was some risk off flows. The price is testing the 100 day MA (blue line in the chart above) at the 1615.31 level. A break bellow should solicit more selling/profit taking after the move higher this week. So far support is holding however. The next key target below would be at 1605. This was the broken trend line off the highs going back to March. This week, the price moved above this level (yesterday). A failure back below, would not be welcomed by longs.