The Commodity Currencies are under pressure in today’s trading (CAD, AUD and NZD)
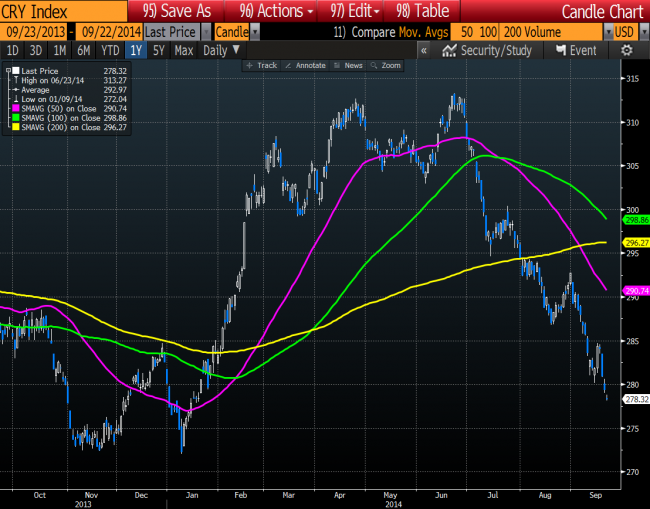
A measure of commodities overall can be found in the CRB (Commodity Research Bureau) Index. This is an index of a the major commodities including Energy, Grains, Industrials, Livestock, Precious Metals and Soft Commodities.

Technical Analysis; The CRB Index is trading at the lowest level since January 2014
Looking at the chart of that index, it is trading at the lowest level since mid January 2014. The momentum to the downside has been accelerating. Contributing to the weakness is the slowdown in China and a sluggish EU economy as well.
Yesterday, China’s Finance minister Lou Jiwei said that growth in China faced downward pressure. The Peoples Bank of China, announced stimulative measures last week to combat the slowing economy.

The commodity currencies are showing weakness with the AUD the weakest
A snapshot of the commodity currencies today (see % change from Friday in the chart above) , show that they all are showing weakness (see chart above). The Australian dollar is the weakest of the three (down against all the major currency pairs). Australia is impacted the most by a slowdown in China.

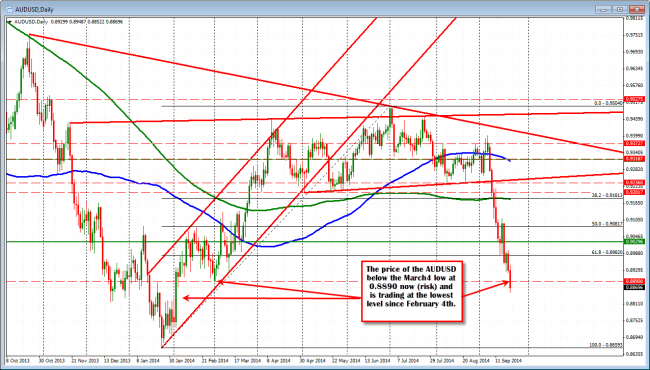
Technical Analysis: AUDUSD chart shows the pair is trading at the lowest level since February 2014
Looking at the AUDUSD from a technical perspective, the pair is trading at the lowest level since February 4th (see daily chart above). The move lower from the daily chart has been quite dramatic this month, with the pair moving from a high of 0.9400 to the low today of 0.8852 so far today (the pair is trading at the lows).
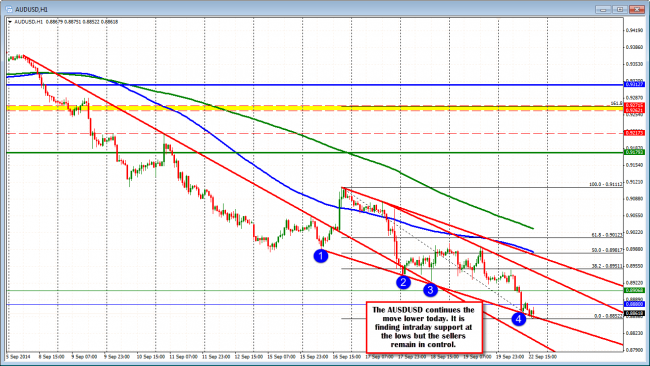
The hourly chart below, is showing a test of the lower trend line connecting the recent lows over the last 5 trading days. Each bounce off this line has been minimal, but there may be an interest to take some profit/dip buy – with stops below a new lows at this area.

Technical Analysis: AUDUSD is testing the lower trend line.
Where would a correction go if it does gather steam?
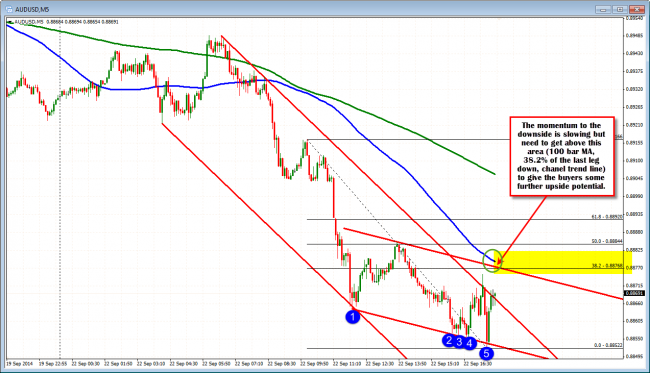
Looking at the 5 minute chart, the price momentum lower is showing a slowing at the lows too (see chart below). The lower trend line has held and this combined with the support from the hourly might increase the willingness to buy a dip today.
However, to show that they can take firm control, the buyers of the AUDUSD will need to take the price above the 100 bar MA (blue line in the chart below) and other technical levels around the 0.88768 area (see chart below). So although there is cause for pause (at least temporarily) there is cause for concern for any buyer as well. A battle is starting with the slowing momentum. If the buyers want to take more control, it is up to them to prove they can get the price above the 0.88768 level.

Technical Analysis: The 5 minute chart of the AUDUSD also showing support.


