
July 2020 US retail sales data:

- Prior was +7.5% (revised to +8.4%)
- Ex autos and gas +1.5% vs +1.0% expected
- Prior ex autos and gas +6.7% (revised to +7.7%)
- Ex autos 1.9% vs +1.3% expected
- Control group +1.4% vs +0.8% expected
- Prior control group +5.6% (revised to +6.0%)
- Sales +2.7% y/y % vs +1.1% prior
- May-July sales down 0.2% from the same period a year ago
The details of this report are much stronger than the headline and the revisions were significant.
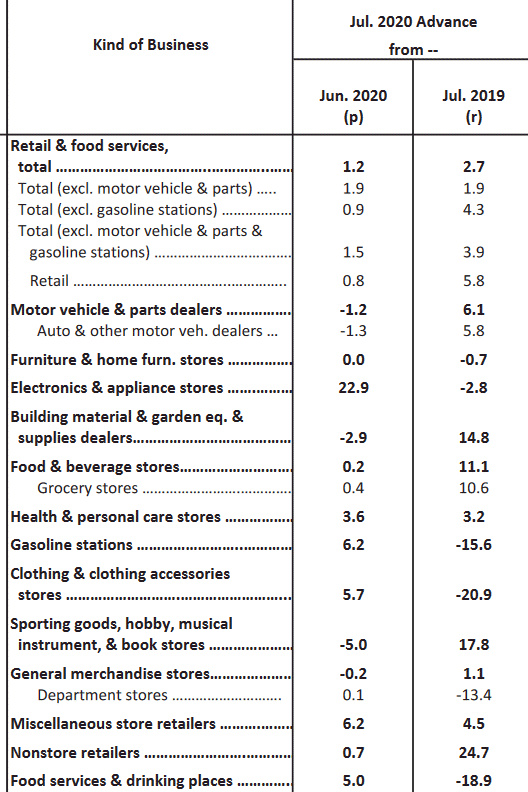
Looking at the overall picture, there are still larger dislocations in retail sales and a huge dislocation in 'non-store retailers' which are online shopping.
Some analysis from BMO:
That said, headline aggregate retail sales are now 1.2% higher than the January peak -- while the control group is 7.3% higher over the same time window. 9 of 13 categories rose in July, versus 11 in June and all 13 in May; the two biggest contributions to sales were eating and drinking (+0.49%) and gasoline stations (+0.41%). Overall, evidence that consumption remains in reasonable shape given the lockdown realities of the pandemic.

