Trades above and below the August lows
As well documented, the GBPUSD is down on Article 50 chatter. That got the ball rolling from the start.

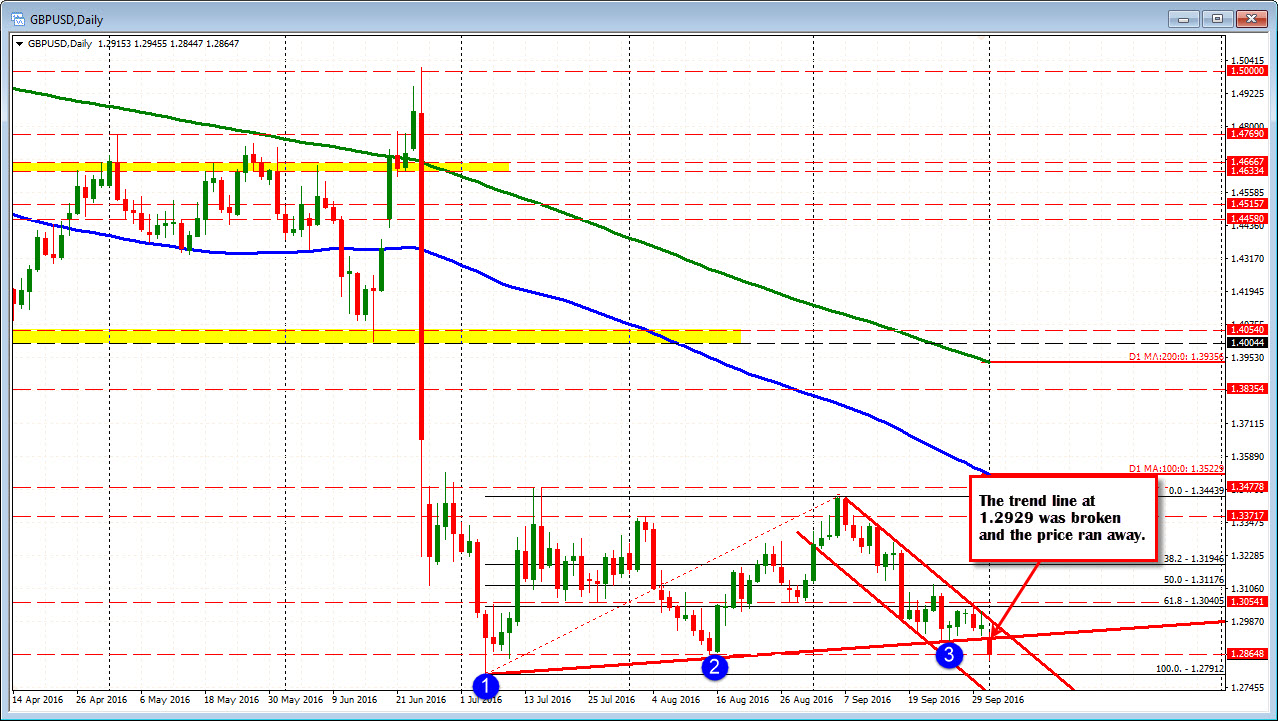
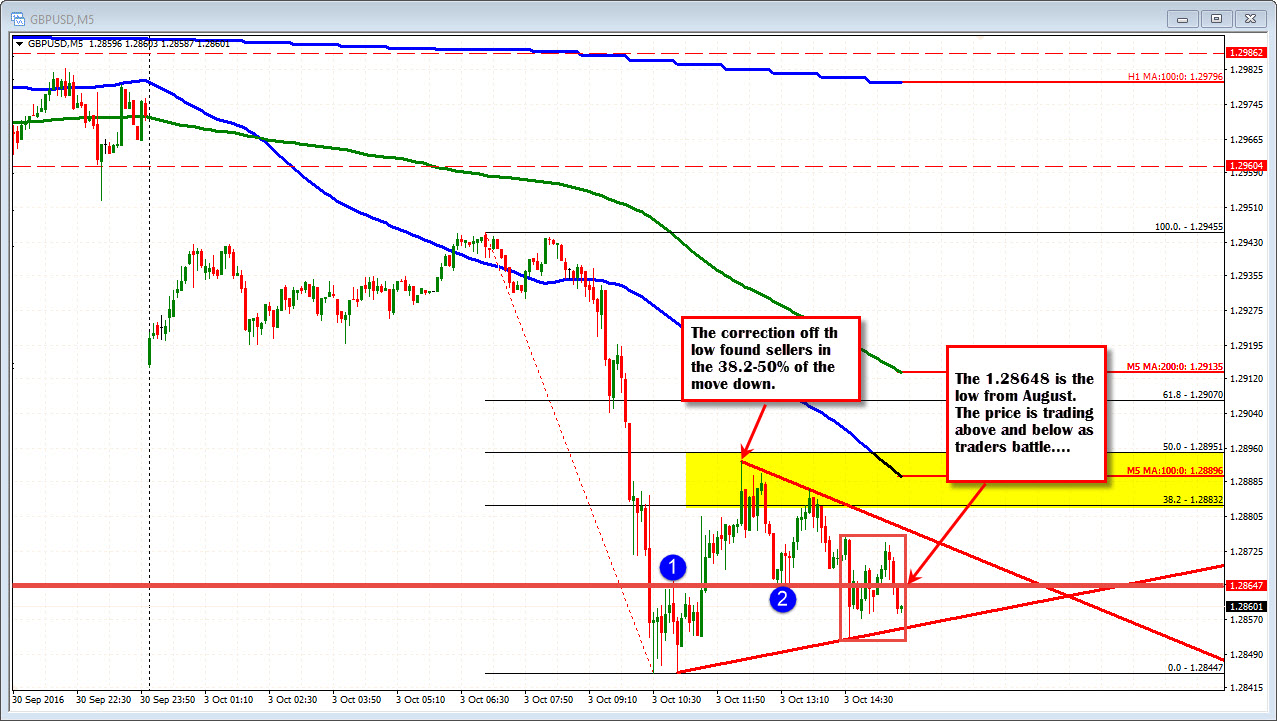
Technically, the pair moved below trend line support on the daily chart, and even made it below the August low of 1.28648. The UK PMI data (55.4 vs 52.1) helped the pair rise above that level (see 5-minute chart below), and there has been an effort to stay above. However, that correction has stayed below the 50% retracement level (of the days trading range) keeping the sellers more in control. Over the last hour the price action has been above and below that line. We currently trade just below the level.
So traders are fighting it out between converging trend lines with the 1.2855 and 1.2877 the points along those trend line currently. .

The fireworks from the weekend news has slowed down,but the sellers are trying to exert more control. Watch the lower trend line at the at the 1.2855 level for intraday trading clues. A move below will keep the sellers happy and keep the hope alive for a test and break of the low (the low for the year comes in at 1.27912).
A successful hold, may turn some of the sellers into buyers and lead to some further short covering toward the 1.2877. Ultimately though a move above the 100 bar MA (blue line in the chart) and the 50% retracement line, will be needed to show, buyers are more serious.
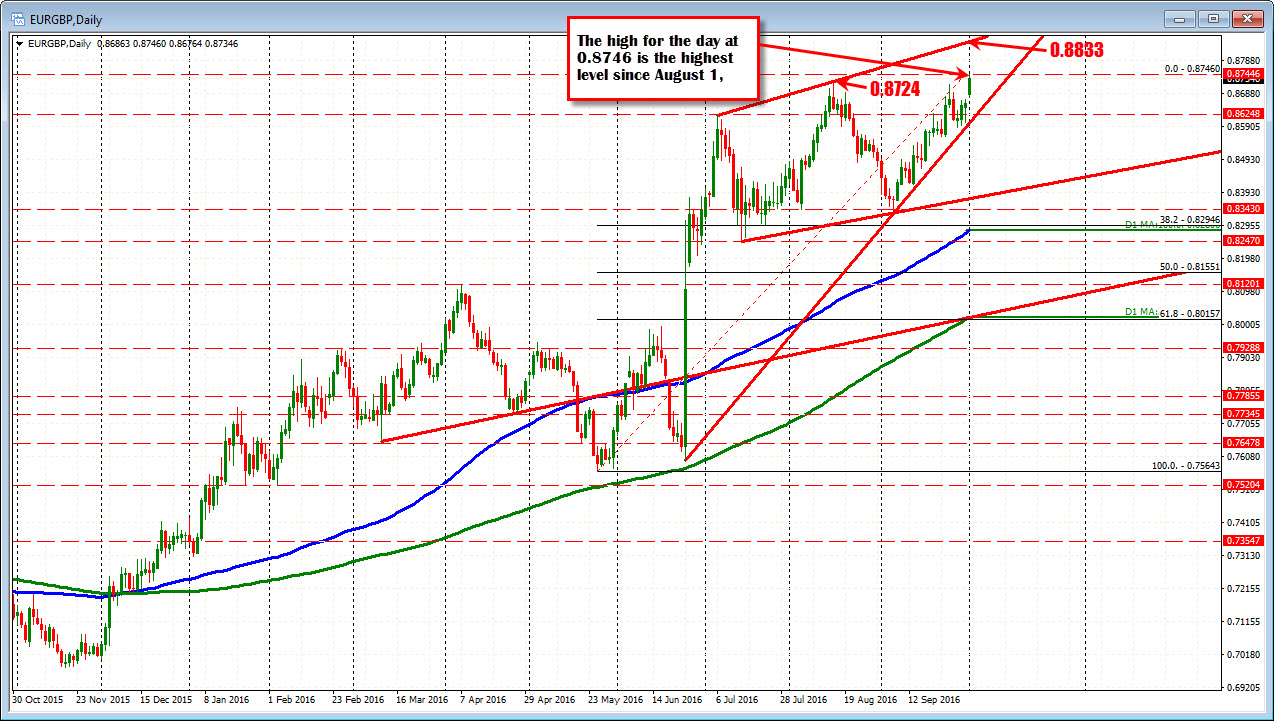
PS EURGBPs has helped the pair as well. It surged higher and trades at the highest level since August 1, 2013.


