Price trades between 100 and 200 day MA
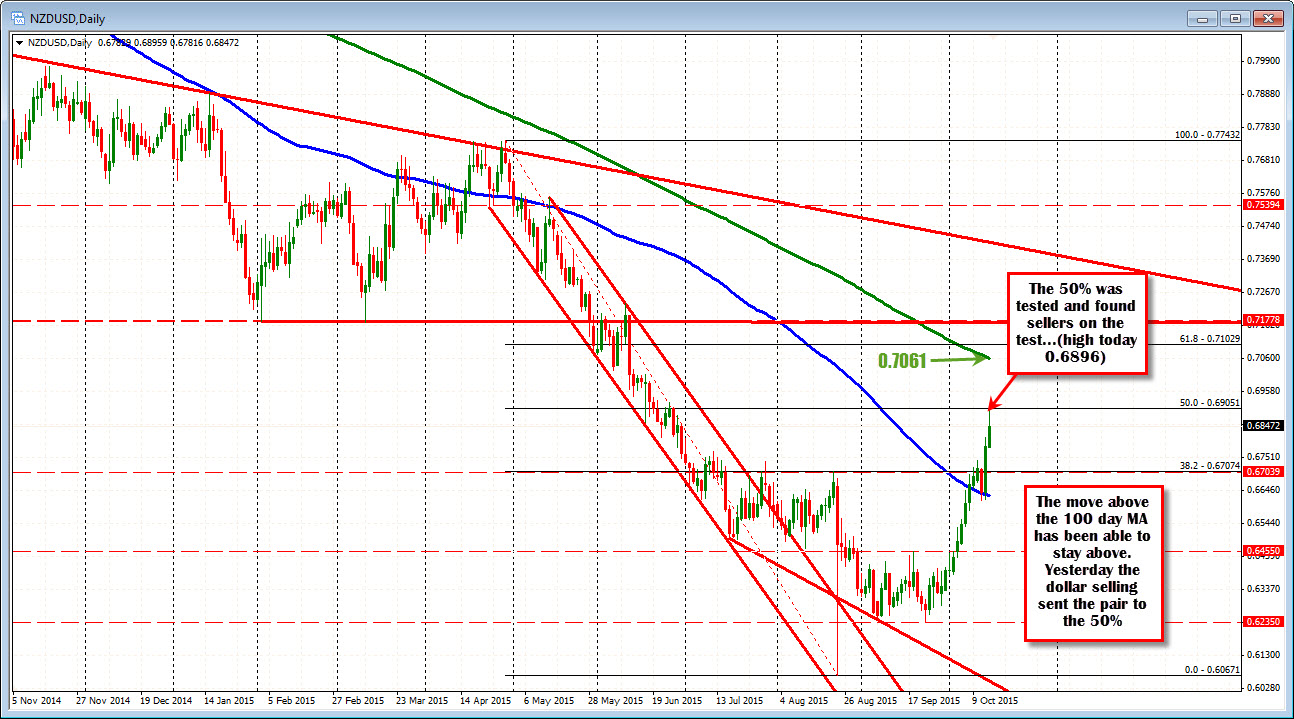
The NZDUSD moved above the 100 day MA on October 8th (6 trading days ago) and has closed above the key MA on each day since then (see chart below).

Yesterday, the price moved sharply higher on the back of weaker US data and a broad dollar decline. Today, that momentum was extended in early European trading. The high price came in at 0.6896. The 50% retracement of the move down from the April high came in at 0.6905. So, the price sniffed the 50%, and found some sellers.
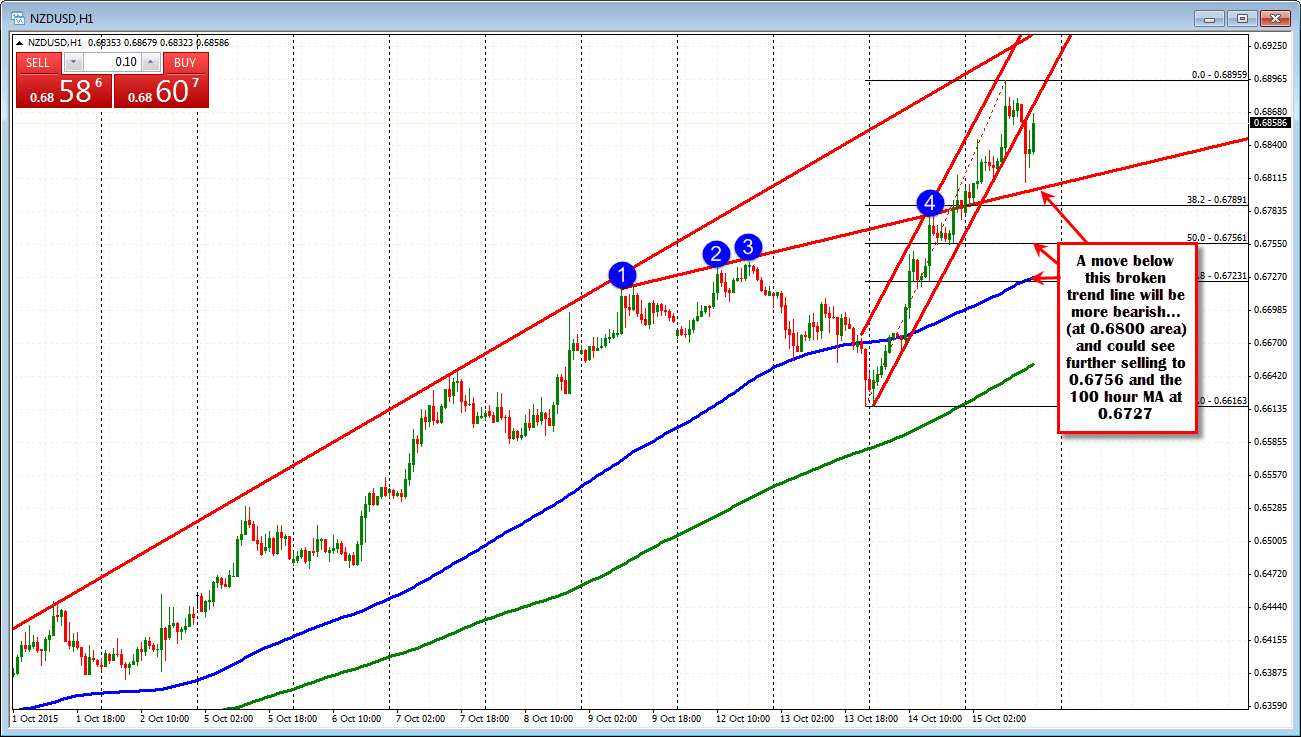
The better US data today initially sent the pair lower but we are currently seeing a rebound on the back of "risk on" demand (equities are higher today). Dudley's comments are awaited at 10:30 AM ET.
Looking at the hourly chart below, the price decline came near the underside of a broken trend line. That level currently comes in at 0.6802 (call it 0.6800). A move below that line, should solicit more selling with the 50% at 0.6756 and the 100 hour MA at the 0.6727 being the next targets..
Meanwhile, the underside of the channel trend line comes in at 0.6973. A move above that level, and then a move above the 50% at 0.6905, will be more bullish and could see traders focusing on the 200 day MA (green line in the daily chart above at 0.7061).
PS Fundamentally, RBNZs Wheeler did comment two days ago that further policy easing was "likely" but added the caveat that it will be dependent on the "emerging for the economic data" . On the headlines, the price declined to the 100 day MA but found support buyers in that area and the rally resumed.


