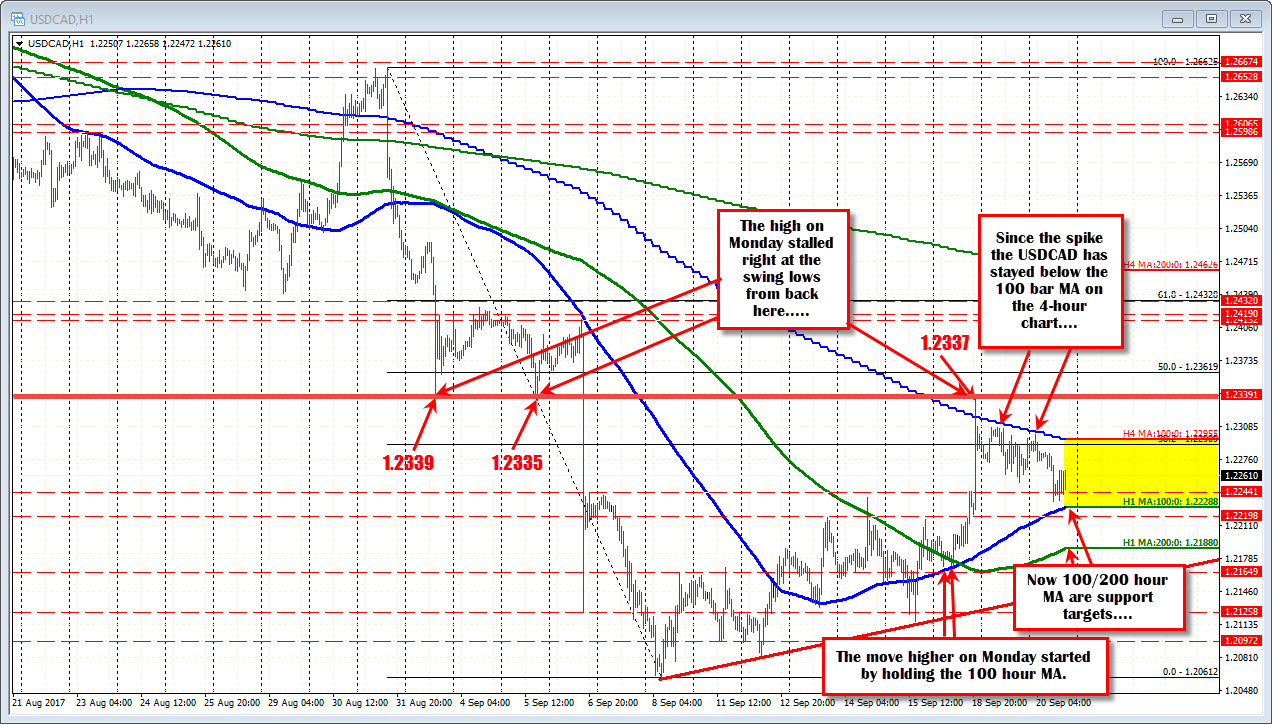
Above 100 and 200 hour MA but stalling against 100 bar MA on 4-hour chart...
The USDCAD on Monday ran higher on a break above the 1.2244 level. That was the corrective high post-Bank of Canada "surprise" hike on September 5th. That break lead to a quick run up toward the swing lows from August 31 and September 5th. (between 1.2335-39). The high price on Monday reached 1.2337 and backed off.

Where did it back off to?
Looking at the hourly chart, the pair fell back below the 100 bar MA on the 4-hour chart (blue step line on the chart above) . That MA comes in currently at 1.22955. Around that level is the 38.2% of the move down from the August 30 high at 1.22909. That area (1.22905-1.22955) will be a barometer for bulls and bears. A move above increases the bullishness for the pair. A move above the 1.2339 will be eyed on a break above the MA level.
On the downside, the 100 hour MA (blue line at 1.22287) started the rally on Monday (support held twice). It is a key level on the downside today. Move below and the bullish/bearish barometer turns more to the bearish side again.
An additional target on the downside is the 200 hour MA.
Summary: The pair sits between resistance above at the 100 bar MA on the 4-hour chart at 1.2295 (with the 1.2339 another key target), and support at the 100 hour MA at 1.22287 (with the 200 hour MA at 1.2188 another downside target).
Like all pairs today - especially against the USD - the FOMC decision will be an influence. The market will be looking for the bias and breaks will help to tell the bullish or bearish story.


