Technically more bearish.
The GBPUSD had a volatile time of it after the NFP report.
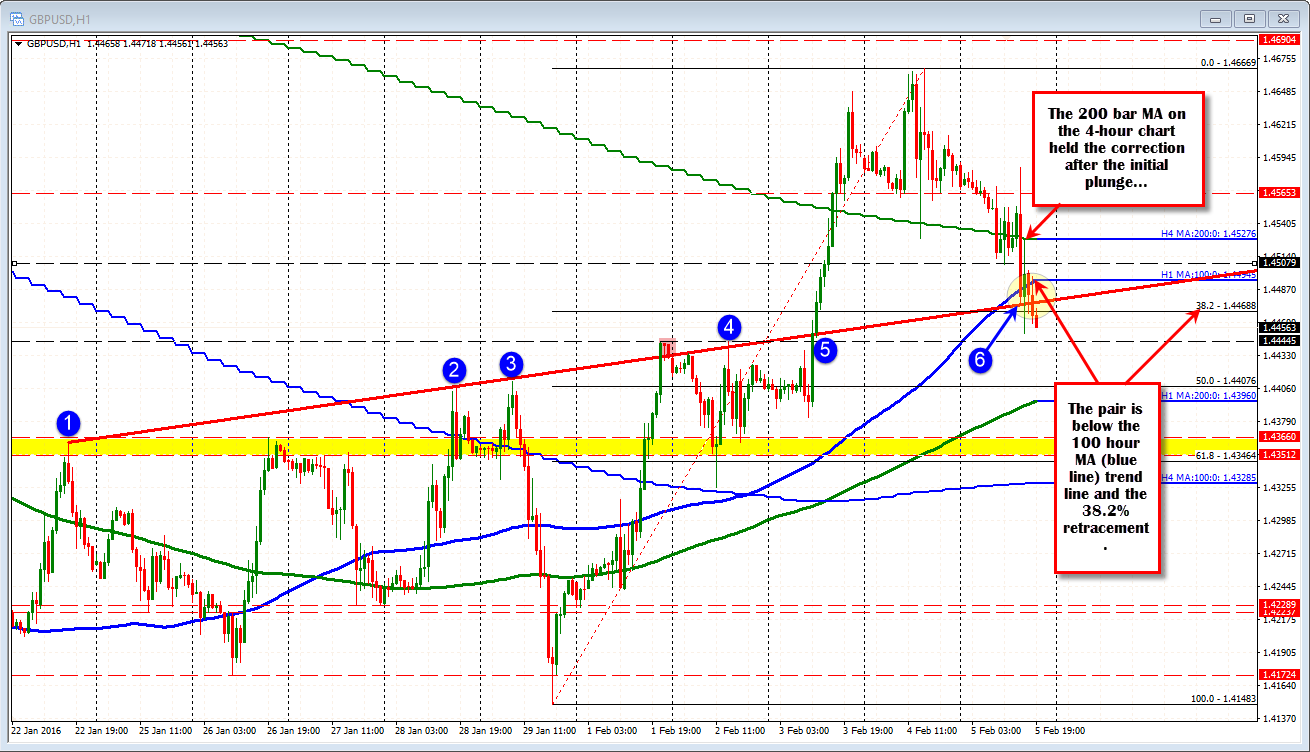
After the initial move higher on the headline NFP numbers, the pair fell sharply lower and took out the 100 hour MA and trend line support in the process. The tumble took the price to what is the day's close at the 1.4450 level. This was just above the high prices seen on February 1 in February 2 at the 1.4444 level.
The subsequent bounce off the day's lows, took the price all the way up to the 200 bar moving average on the 4-hour chart, which comes in at 1.45277 (overlayed green line on the chart below). That level held like a charm and the bias has been more negative/bearish since that time.

We are currenly hanging below the 100 hour MA (blue line in the chart above) at the 1.4495 level and below an old trend line that slashed across at the 1.4474. The 38.2% is at 1.44688 and the price is above and below that in trading over the last few hours.
The bias is more bearish below these techincal levels (stay below the 100 hour MA now to keep the bears in control). The volatility has slowed yes, but the rallies are limited. A move below the 1.4444 level might solicit more selling - although remember it is Friday so there is the weekend risk that may or may not limit the action.
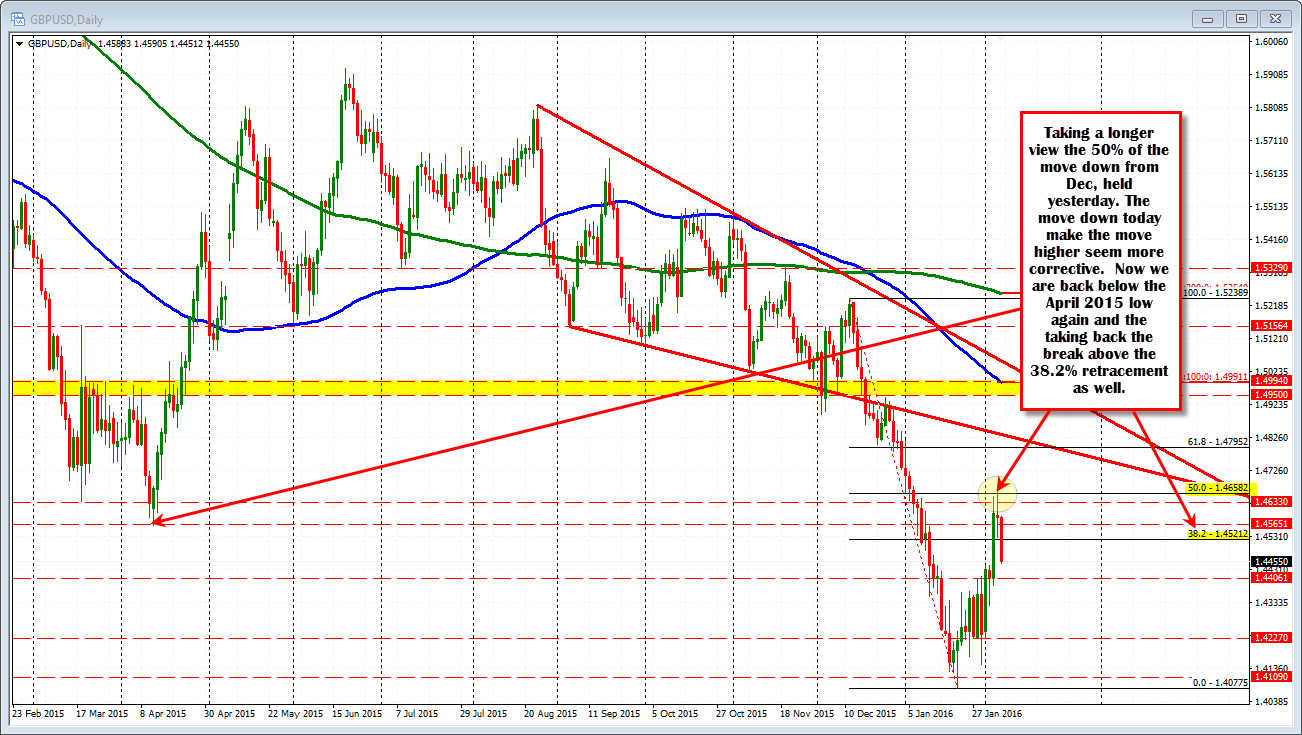
Nevertheless, if one were to take a step back. Look at the daily chart, and combine with what we are seeing here, the sharp move higher this week, corrected to the 50% of the move down form the December high (see chart below) and now we are back below technical levels on the hourly chart. So the more higher looks more corrective and that may be the theme into next weeks trading that gives it more of a bearish bias once again.


