USDJPY finds 123.60 to much today but it's not straying far from the highs
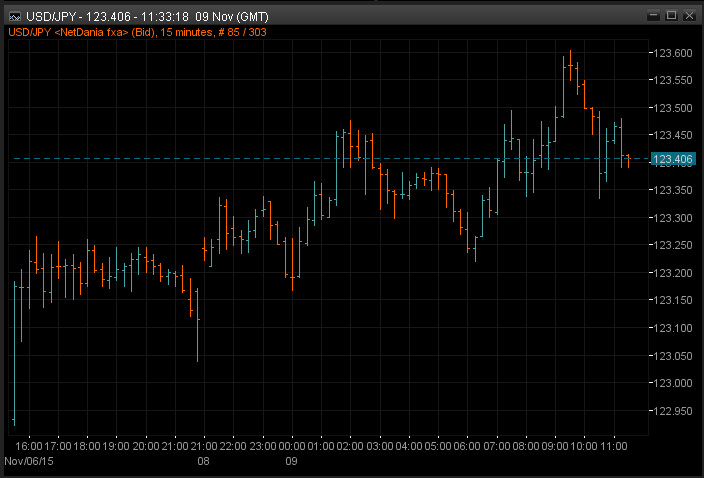
USDJPY is looking a touch soft as I start looking over the charts. We're down at 123.40 with intraday support around 123.30/35 and 123.15/20

USDJPY 15m chart
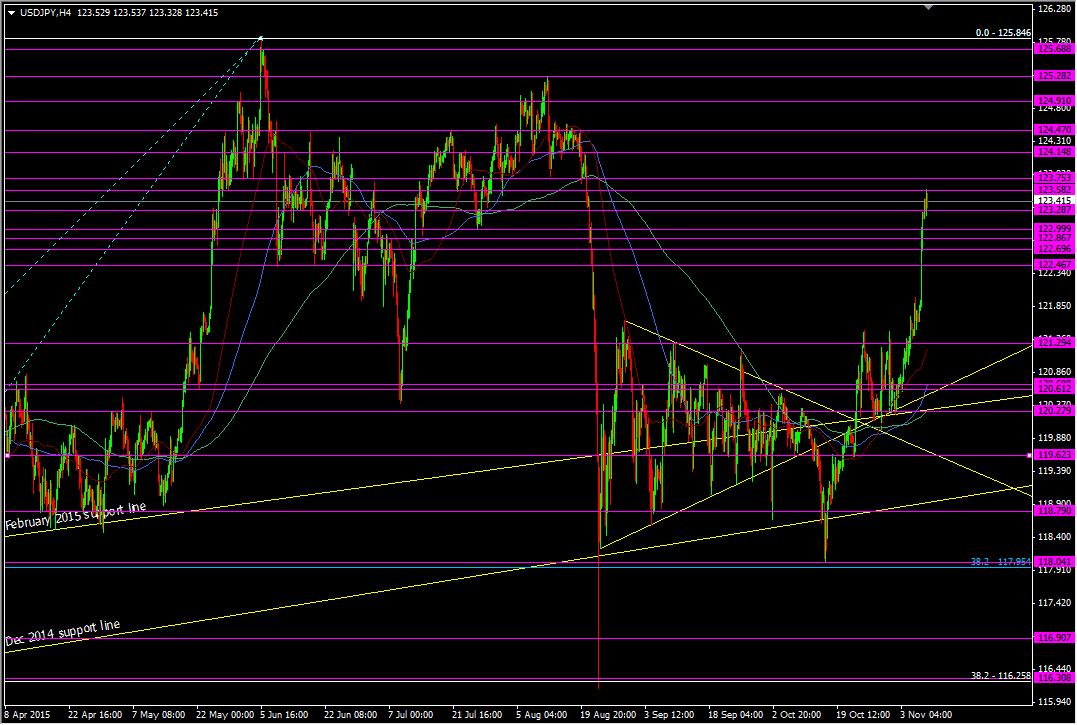
Looking at the bigger picture, 123.50/60 was an area of support and resistance when we went into the 125's earlier this year. In otherwise quiet trading it's playing resistance again

USDJPY H4 chart
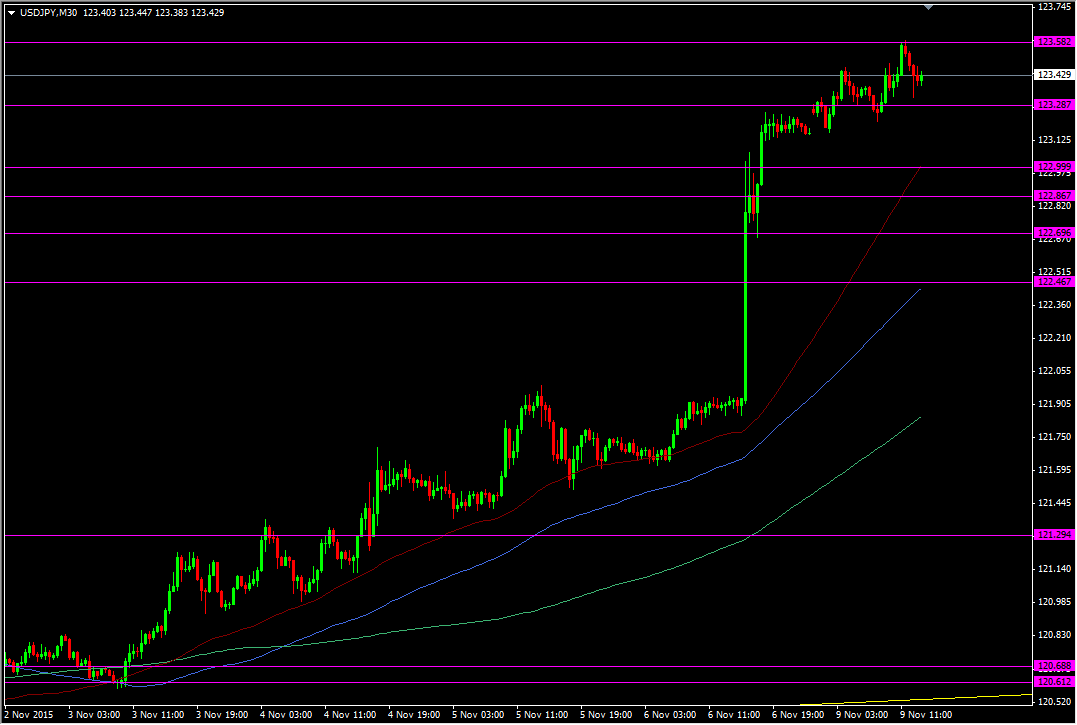
Further up 123.75 is the next resistance spot to watch and then 124.15, after 124.00. While Friday's action may have gone through a few resistance points with ease, they may still play a part as support if we come back down. 123.00 was strong on the way up and so is a consideration. 122.85/90 didn't look like much but 122.70 had more to say for itself

USDJPY 30m chart
The market is pretty certain that the Fed are hiking in Dec and so we're likely to remain well bid until then. Any soft (but not catastrophic) data will likely be hovered up so we're firmly in dip buying mode once more. Given the sharp move on Friday we should still be cautious that we don't see a sharp move south if the support levels break. If you're not already long from lower down then trading the break of the upper levels is your way in. If you're short up here then you really want to see 123.00 break as your first signal that the trade can run.
Not a lot on the calendar today but Fed's Rosengren is speaking later. He's been hawkish of late but was a bit worried over the jobs market in comments in October. He should be happy with Friday's showing. He's up at 17.00 GMT


