
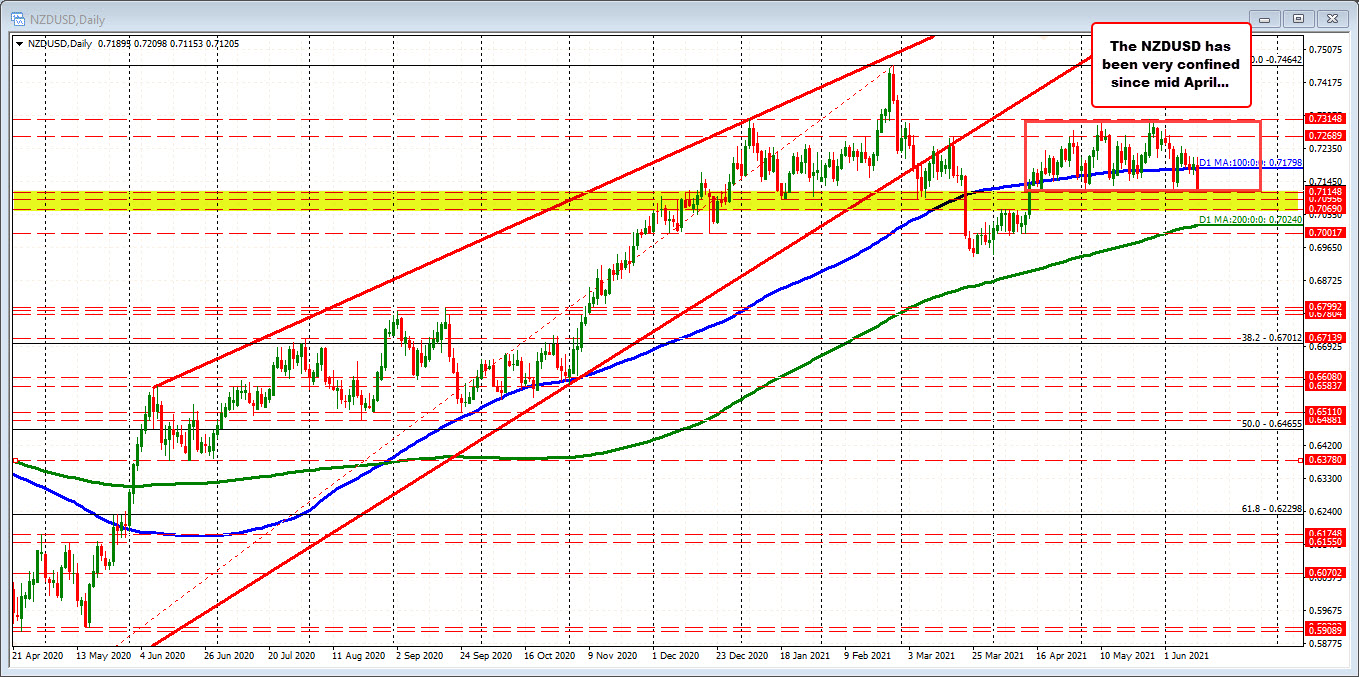
Low from May tested at 0.71148
The NZDUSD has been trending lower over the last 9 hour of trading. The move has taken the price from a high of 0.72098 to the lows of 0.71153 (or about 95 pips). That low took out the June low at 0.71248, but is so far just testing the May low at 0.71148.

Helping the bearish bias today was the selling near the 200 hour MA (green line). At the high for the day, the price did move above that MA briefly, but quickly reversed. The move below the 100 day MA at 0.71795 added to the bearish bias. The fall below the low for the week at 0.71644 was another bearish catalyst.
Taking a broader look at the daily chart, a move below the May low at 0.71148 would next target the January swing low at 0.70956. Break below that level and focus will be on some swing highs from April near 0.7069 and the rising 200 day moving average at 0.7024. The price has not traded below its 200 day moving average since June 2020.
The NZDUSD is the biggest mover today with a decline of -1.12% currently.

