
What are the charts saying for the major currency pairs.
Heading into the new trading week, what key technical levels are in play that traders around the world will be watching (and why?). Below are the stories.....
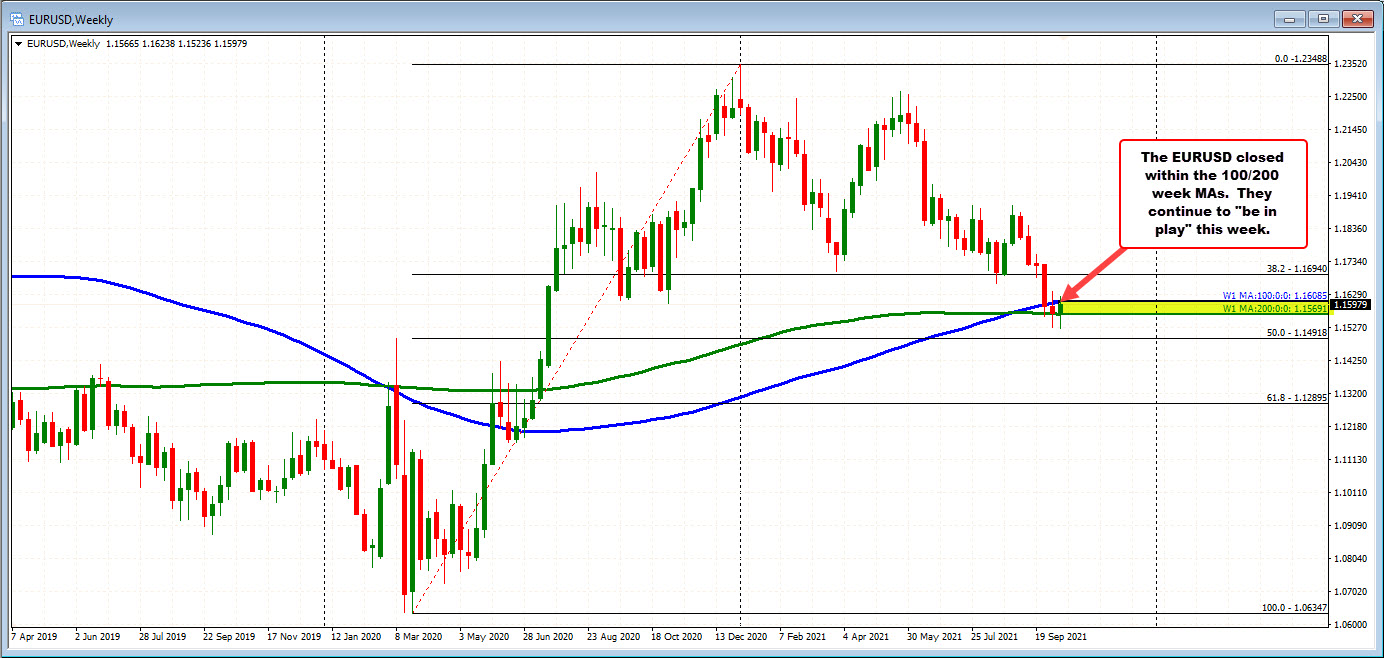
EURUSD:
The EURUSD traded to a a new low for the year this week taking out the October 6 low at 1.15284. That's the good news. The not so good news is that the new low was only about five pips lower than the previous low at 1.15236. Sellers did not exactly endorse the break.

The inability to run to the downside led to corrective price action on Wednesday and Thursday. The high price reached 1.16238 on Thursday before correcting lower in the North American session. On Friday, the price traded up and down and closed trading near the midpoint of the range for the day at 1.1603.
Technically on the hourly chart above, the low price on Friday reached near the low from Thursday and also stayed above a swing area between 1.1583 and 1.1586 9see green numbered circles in the chart above). That area along with the rising 100 hour moving average at 1.1575 and sideways 200 hour moving average at 1.15704 are barometers on the downside in the new trading week. Move below those levels would increase the bearish bias. Stay above and the corrective buyers hold onto at least some control (with work to do).
On the topside, the 100 week moving average cuts across at 1.16085. Getting and staying above that level in the new week would disappoint the sellers who sold on the break below both the 100 and 200 week moving averages two weeks ago.
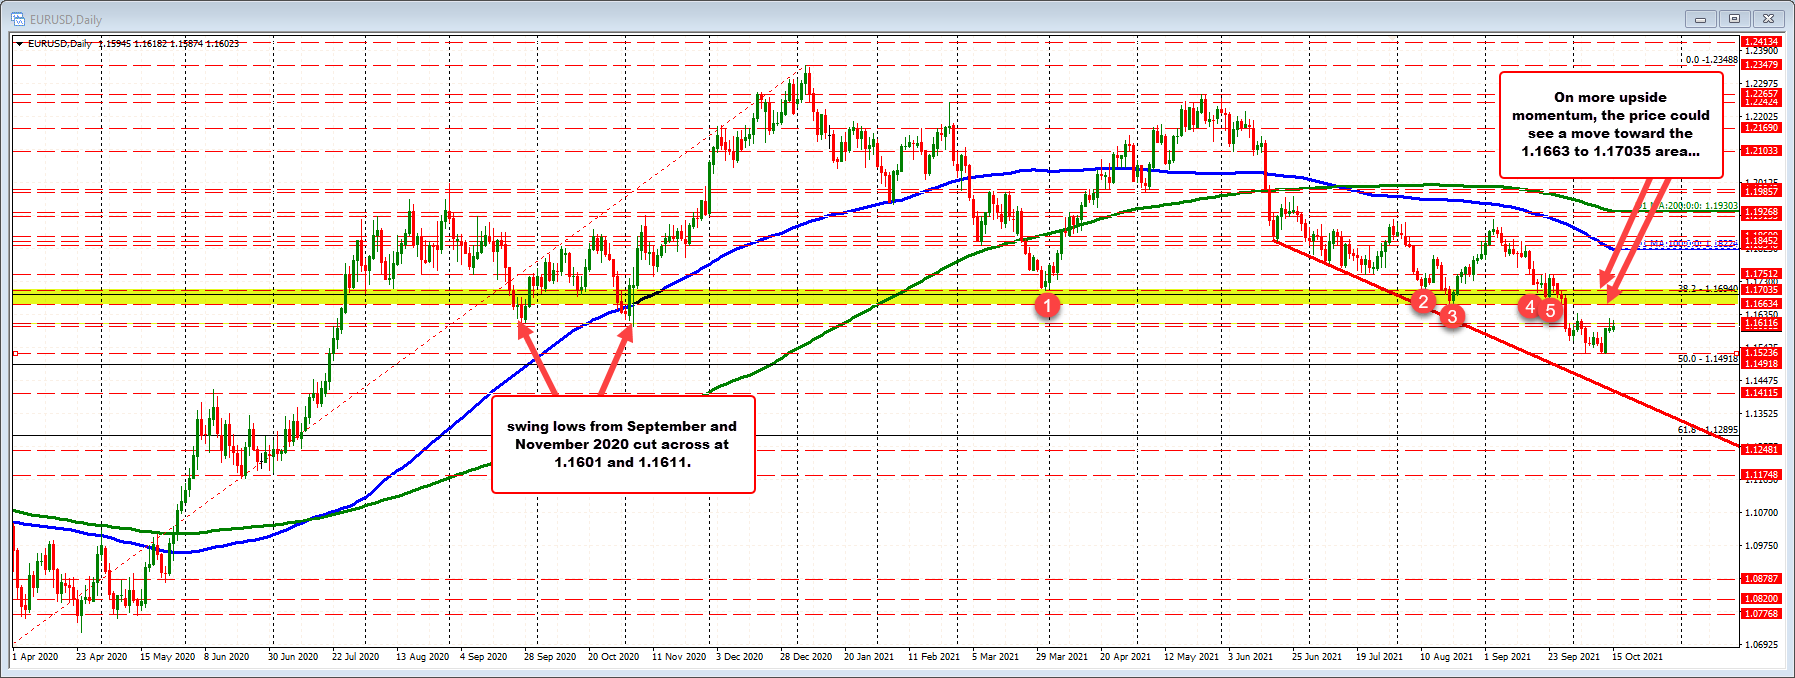
Also near that 100 week MA level are swing lows from September and November 2020 (see daily chart below) which came in at 1.1601 and 1.1611 respectively.
As a result, a move above that area would have traders looking toward a swing area between 1.1663 and 1.17035 also from the daily chart below. Move above it and the buyers can claw back even more control from the sellers on the disappointment from the break to the downside.
PS. The 200 hour MA is at 1.1570. The 200 week MA is at 1.1569. The EURUSD traders are looking for the next shove and the technical levels (above and below) are there to give that push.
GBPUSD:
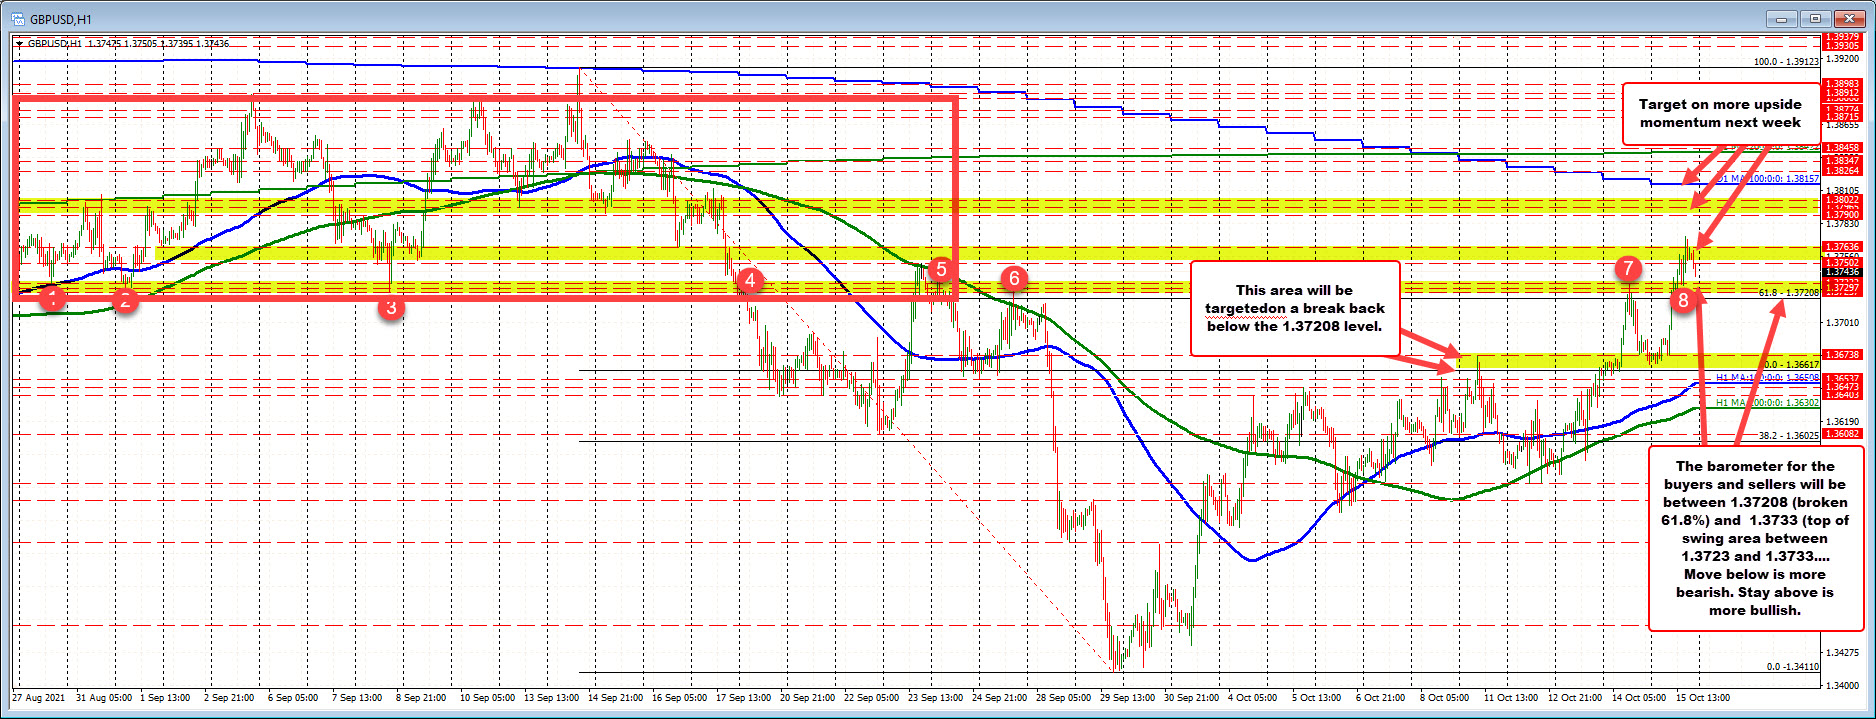
The GBPUSDs major technical hurdles last week week included getting back above the 50% midpoint of the move down from the September 14 high to the low reached on September 29. That midpoint came in at 1.36617. The low price near the close on Thursday and into the open on Friday stayed above that midpoint level. That gave the buyers the confidence to move higher. On Friday the price reached the highest level since September 17.
On the topside, the price high on Thursday reach 1.3733. That was near the high end of a swing area between 1.3723 and 1.3733 (see red numbered circles). Also near that level was the 61.8% of the move down from the September 14 high at 1.37208.
All those levels were broken on Friday on its way to the new week high. The price closed above that area, keeping the buyers more in control.
Needless to say, in the new week a move back below the aforementioned technical levels between 1.37208 and 1.3733 would be a bearish/disappointing development for the break buyers that should lead to a rotation back toward the swing high from last Monday's trading at 1.36738. It would take a move below the 50% midpoint and the rising 100 hour moving average at 1.36617 at 1.36508 (and moving higher) to further increase the bearish bias.
Conversely, if the 1.37208 level can hold support, the next upside target comes in at a swing area between 1.3790 and 1.3800. Just above that is the falling 100 day moving average which will be around 1.3813 on Monday.
USDJPY:
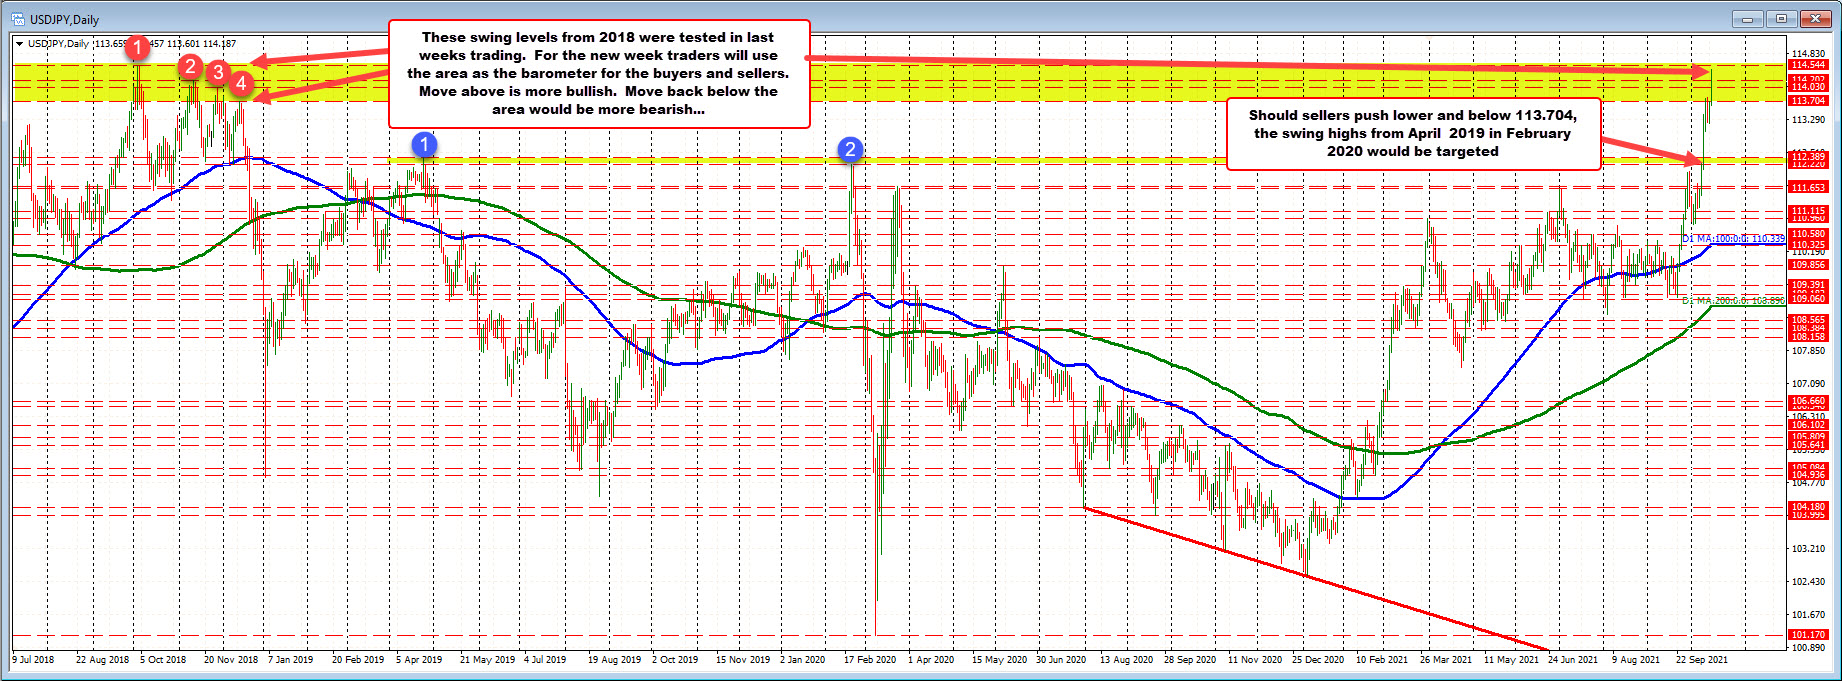
The USDJPY surged higher on Thursday and again on Friday and in the process moved above swing highs from December and November 2020 at 113.704 and 114.20 respectively, but fell just short of the October swing high at 114.54. The price at the end of the week is trading at the 114.18 level between those swing highs going back to November and December in 2020.
In the new week, traders will take their clue from those highs. Trade above the high of the extremes at 114.53 would increase the bullish bias. Conversely trade back below the 113.704 level should lead to more downside corrective probing.
Should the sellers push below the 113.704 level, the rising 100 hour MA (see hourly chart below) comes in at 113.612 (and moving higher - see blue line in the chart below). A rising trend line that held support on Thursday on the hourly chart below comes in at 113.45 (and moving higher). Move below each should see more downside probing with the 113.00 swing low from Tuesday and the rising 200 hour MA at 112.725 as targets.
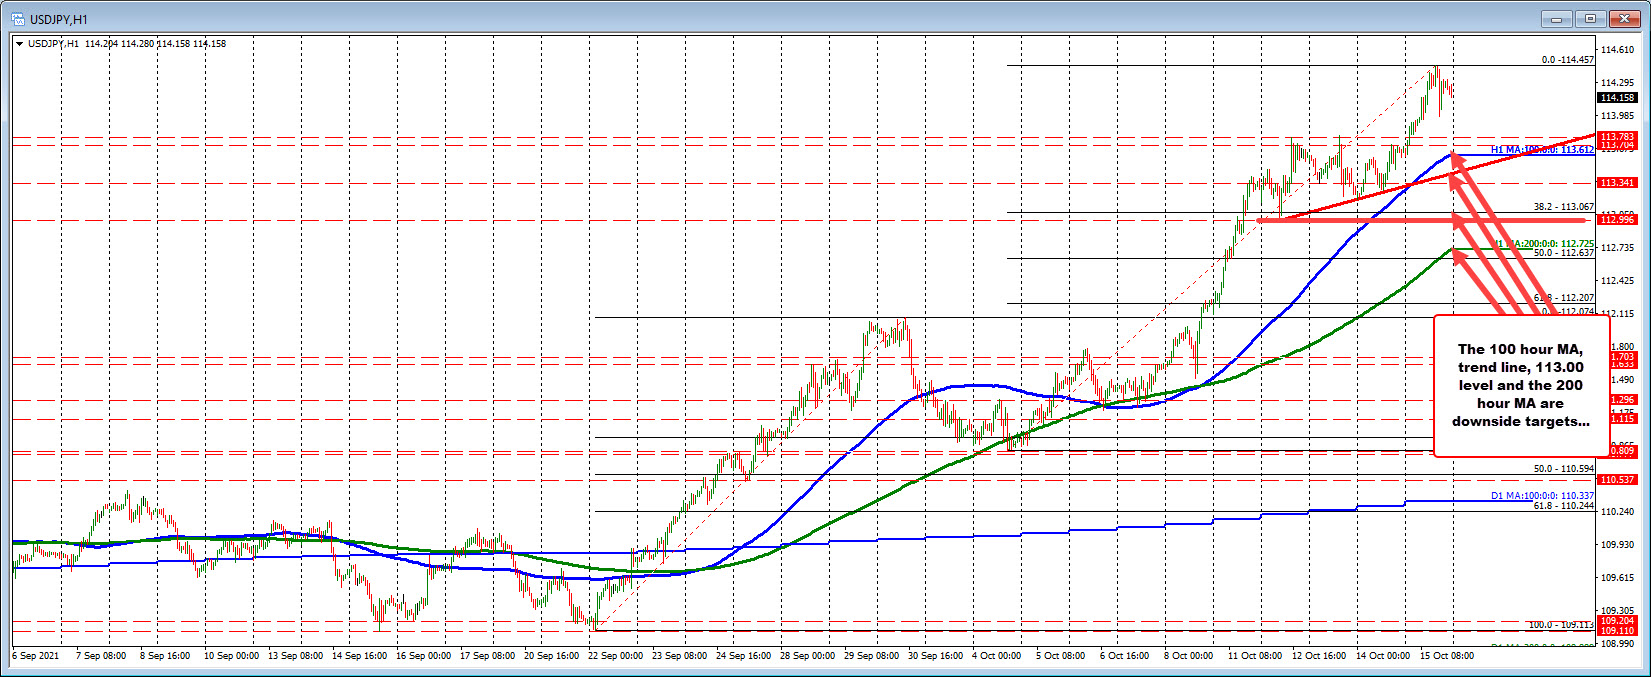
Longer term, the 112.22 to 112.389 swing highs from April 2019 in February 2020 would be targets if selling intensifies.
Conversely if the October swing high at 114.54 level can be broken, traders would next look toward the November 2017 high at 114.73. Move above that level and the door opens up for even more upside momentum as the buyers assume more control. The 115.50 is the next major target on a break.
USDCHF
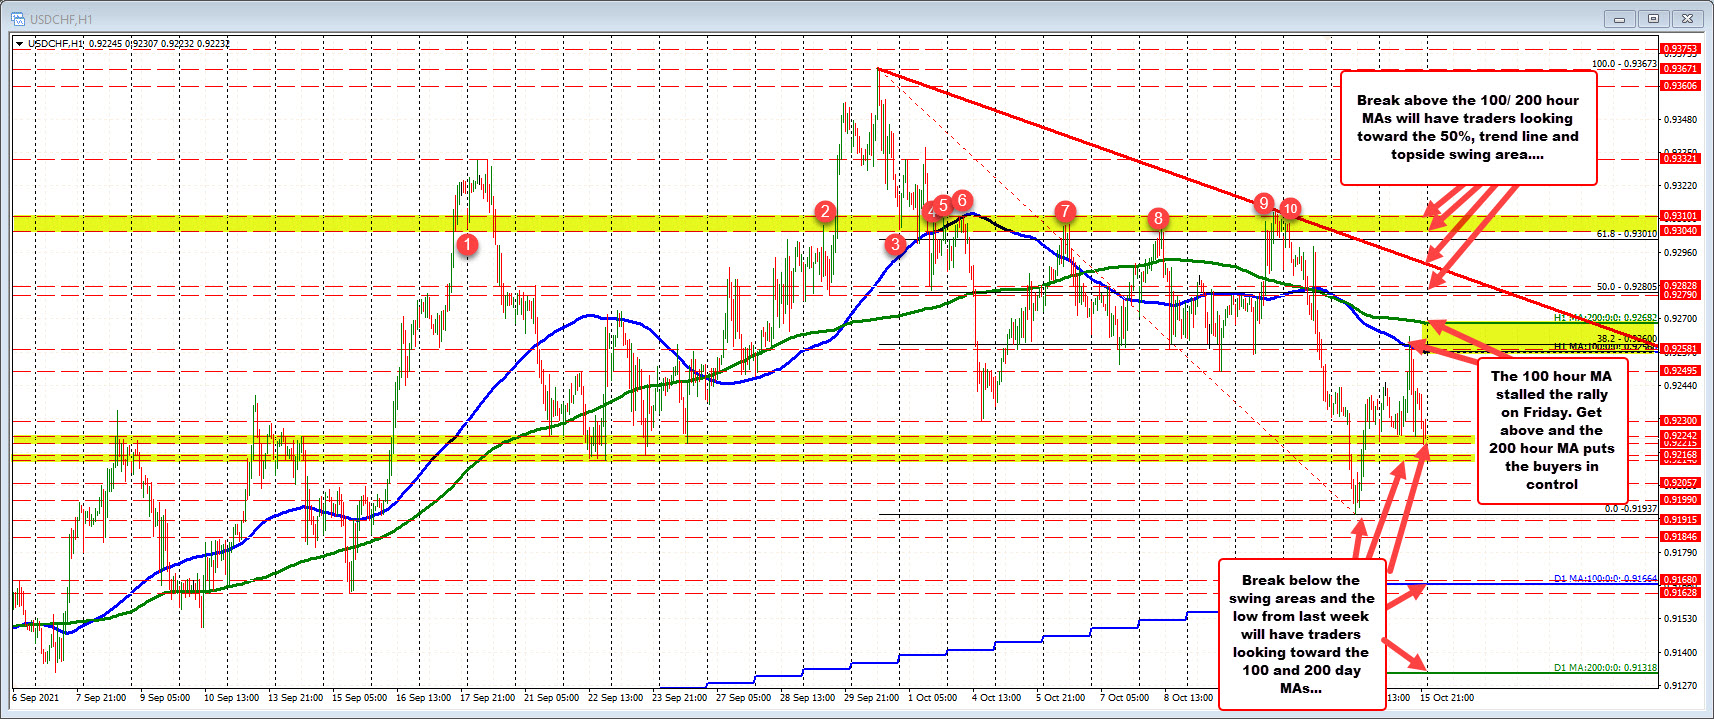
The USDCHF moved up to test the broken 100 hour MA during Friday's trade (blue line) currently at 0.9257. The price spiked just above that MA line, but rotated back below and retraced the entire move up from the 0.9222 Asian session low.
Staying below the 100 hour MA in the new week will keep the sellers in firm control, but there is still work to do.
On the downside last week, the price moved below swing areas below 0.9222 to 0.9224 and 0.9214 to 0.9217 on Thursday, and saw the price run to 0.91937. However, there was a snap back rally above each swing area. The price returned to the higher swing area on Friday but stalled the falls near it. There was some selling apprehension.
In the new week, getting and staying below those swing areas would give the sellers more confidence with eyes toward the low for the week at 0.91937 followed by the rising 100 day MA at 0.91664. Move below the 100 day MA increases the bearish bias and will have traders eyeing the 200 day MA at 0.91318.
On the topside, if the 100 hour MA is broken at 0.9257, traders will get confirmation of the buyers interest on a break of the 200 hour MA at 0.92682. Above that, and the 50% of the move down from the September 30 high cuts across at 0.92805 and a downward sloping trend line on the hourly at 0.92903 (and moving lower) would be next, followed by a swing area near 0.9304 to 0.9310. That swing level has put a stop on the rallies since October 1 (see red numbered circles 4 to 10). Key ceiling if the USDCHF moves higher in the new week.
USDCAD:

The USDCAD closed below the 200 and 100 day MAs on Friday, October 8th. In the trading last week, the price traded back above the 100 day MA on Monday and Tuesday, but closed lower for 4 consecutive days to end the week. The low reached 1.23357 on Friday. The 100 day and 200 day MAs are up near 1.2490 area. Between the current price and the two MAs is a swing area at 1.2422. Traders will be watching that level on a corrective move higher in the new week. Stay below it, and the downside can be further attacked. Move above and traders may look back toward the daily MA levels.
On more downside momentum (stay below the 1.2422) and the next key target from the daily chart will look toward 1.22516. That level separates the lower extreme down to the 2021 lows near 1.2000 - which happened to also be the lowest level since 2015 for the pair.
Drilling to the hourly chart below, the recent trend run to the downside for the USDCAD has seen one day since October 1, where the price moved above the 100 hour MA (blue line currently at 1.24231). That MA is currently right near the 1.2422 swing level from the daily chart, but it is also moving lower with the market.
So in the new week, focus will also be on the 100 hour MA as a risk and bias defining level. If the buyers cannot take the price above it, the buyers are NOT winning. Until then, the trend remains your friend and that is to the downside.

NZDUSD:

When the RBNZ raised rates on October 6th (raised rates by 0.25 basis points), the price moved to a swing area between 0.6976 to 0.6981 and stalled. On that day, the price tumbled lower stalling at 0.6877.
Since then, the price has moved higher 6 of the last 7 trading days with most of the price rise happening over the last two trading days.
The catalyst for the run higher?
Getting back above the swing area between 0.6976 and 0.6981.
The high price on Friday did stall against a swing area that defined a swing area going back to the first half of September (see green numbered circles). That area will need to be broken to increase the bullish bias.
On a break above, the 200 day MA at 0.7098 will be targeted and above that the 0.8119 to 0.7125 . Get above those levels, and traders will eyed the highs from September up to 0.71694.
On the downside, it will take a move back below the 100 day MA at 0.70199 to ruin the bullish bias. Breaking below it, and the 0.7000 and the rising 100 hour MA at 0.6984 (and moving higher) will be eyed by sellers.

