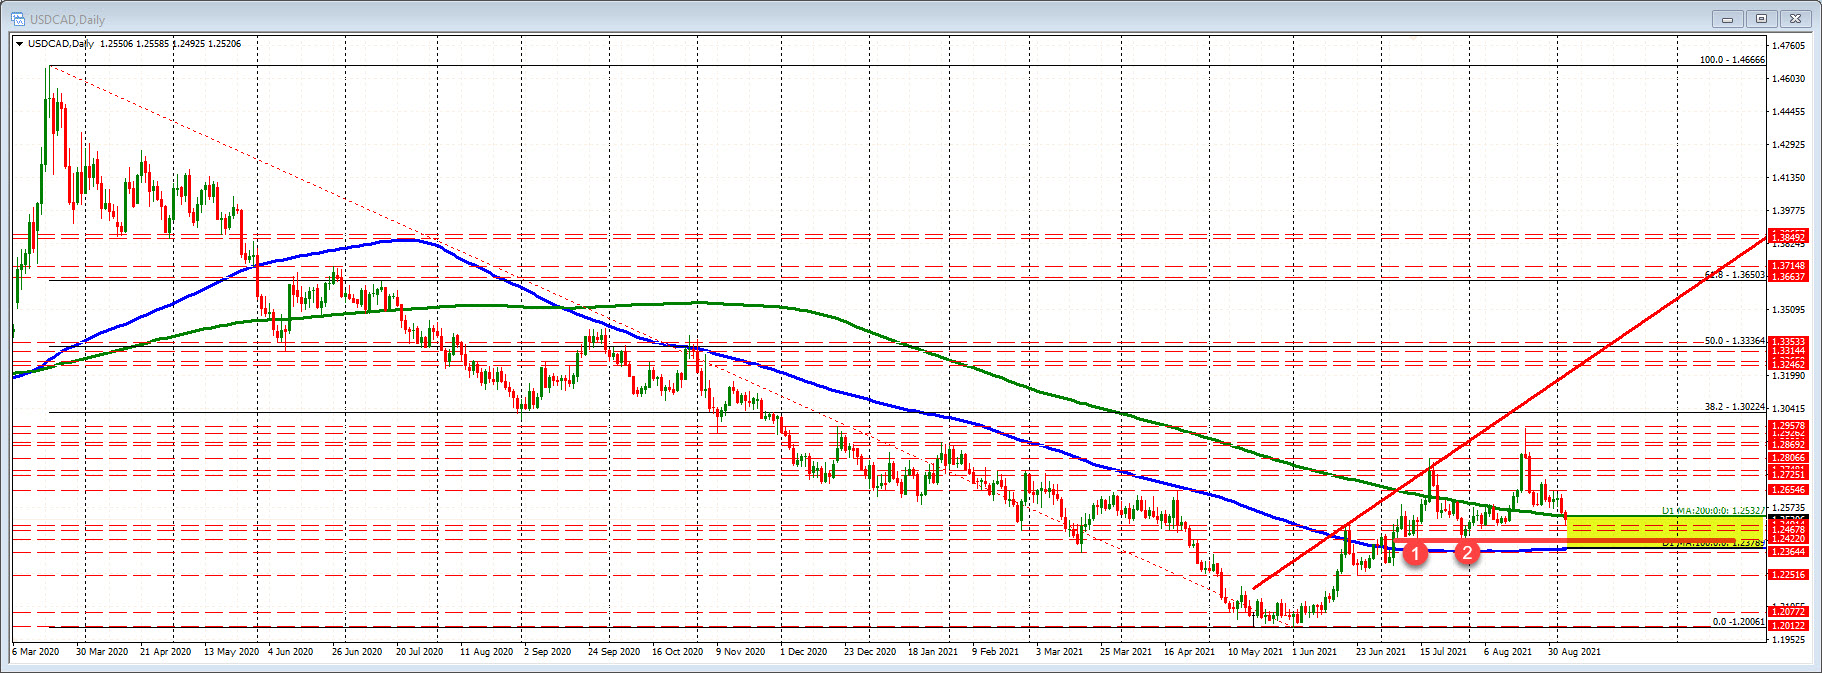
200 day MA at 1.25326
The USDCAD yesterday moved up to test its falling 200 hour moving average (green line). Sellers leaned against that level and in doing so kept the sellers in control. The price ultimately fell below the recent swing lows down to 1.2568.

Today, the pair took a another step with a fall below its 200 day moving average at 1.25326. The last three hour bars have seen the price try to move back above that key level, but sellers returned and have pushed the price back below.
As long as the price can stay below that 200 day moving average, the sellers are many control.
On the downside, the price did fall to test a swing area between 1.2487 and 1.25004. The low price reached 1.2492 so far.
That area will need to be broken to increase the bearish bias.
Looking at the daily chart below, the move higher in the USDCAD moved above its 200 day moving average back in July, failed but moved back above in August.
Now with the price back below that key moving average, the sellers are definitely making a play for increased control. The 1.2422 level was swing lows from July. The 100 day moving averages at 1.23789 will also be new target if the price can stay below the 200 day moving average, and increase the bearish momentum.