
2018 high price comes in at 114.544
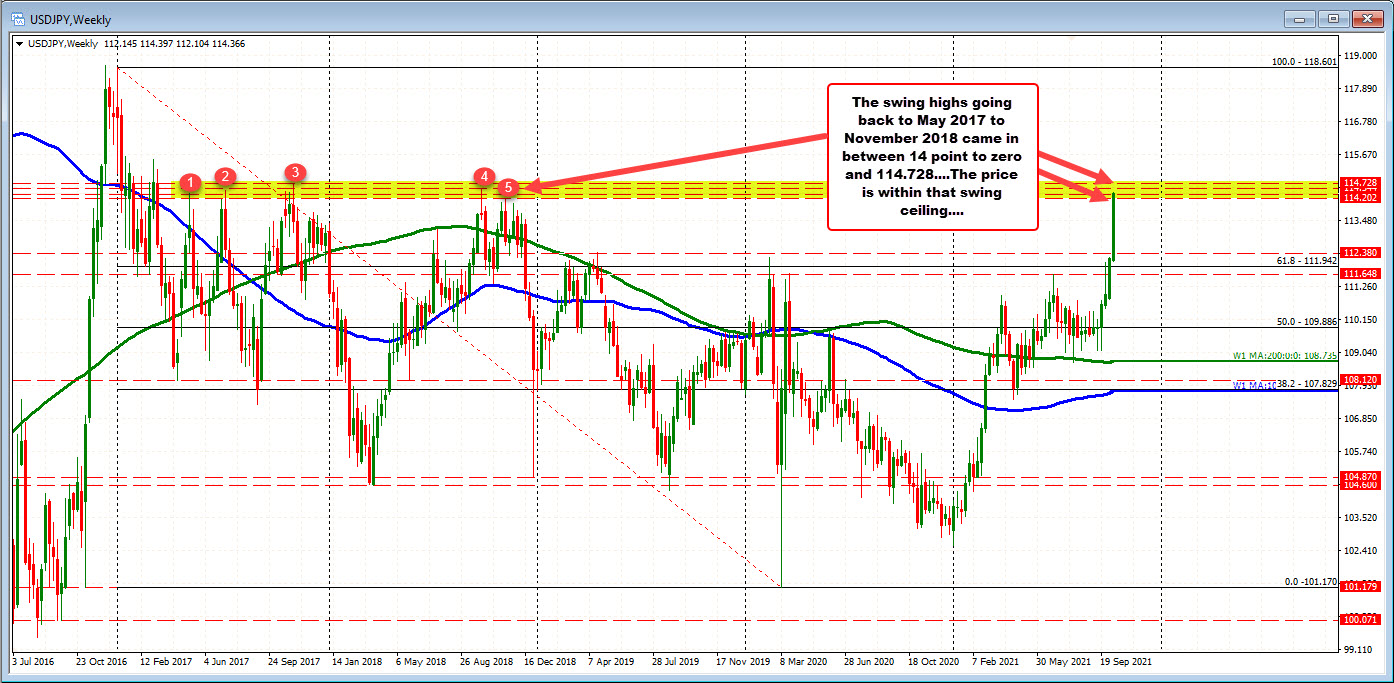
The USDJPY has continued its run to the upside today with the pair crossing above the November 2018 high prices at 114.03 and 114.20. The next target comes in at the October high at 114.54. A move above that level would have the pair trading at the highest level since September 2017 when the price reached a high of 114.728 (see weekly chart). The pair is currently trading at its highs at 114.42 after the stronger Retail sales report and Empire manufacturing indices
From May 2017 to November 2018 five separate swing highs came in between 114.728 and 114.202. The price is within that range (see red numbered circles in yellow area on the weekly chart below)
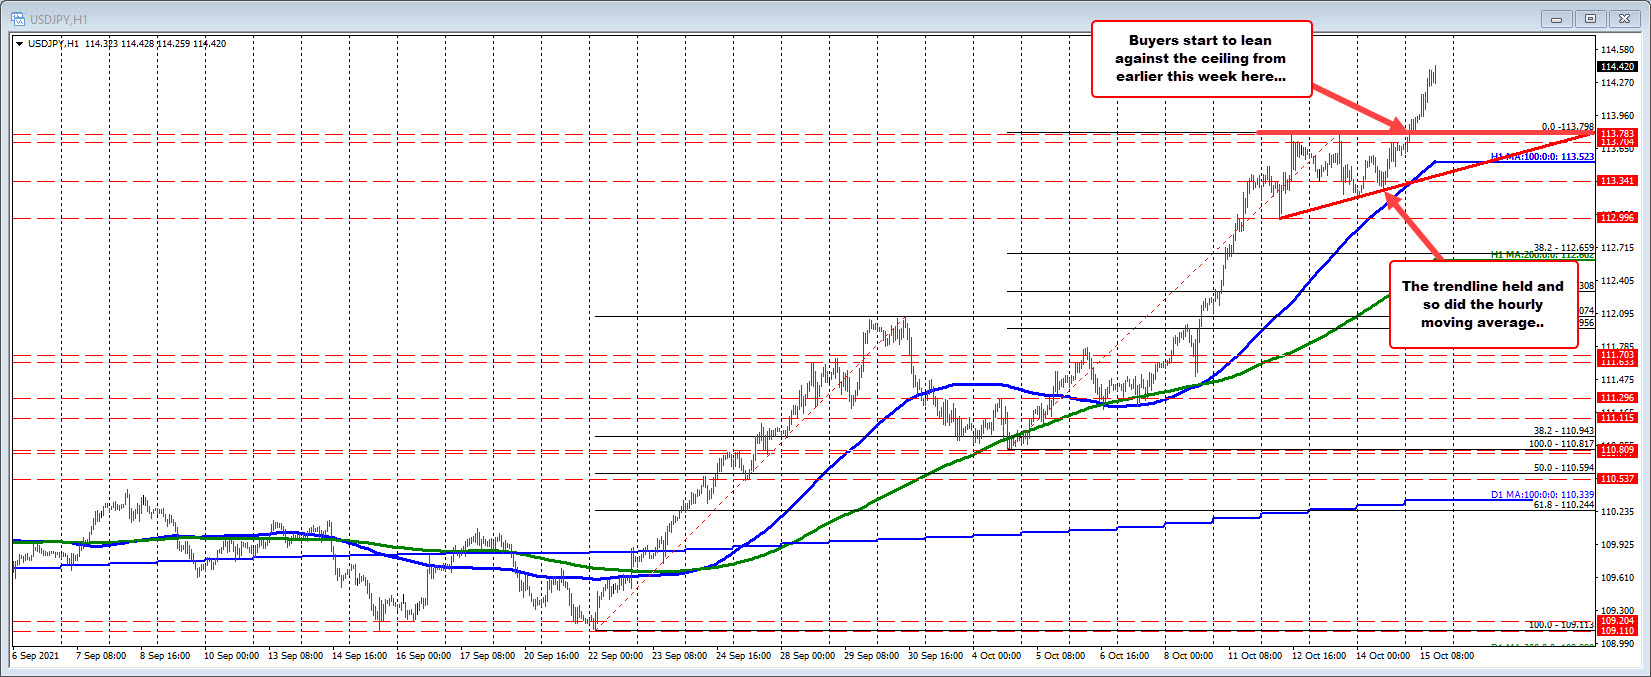
Looking at the hourly chart below, the pair held support against the lower trendline, and ahead of its 100 hour moving average during trading yesterday. The break above the high from Tuesday and Wednesday at 113.798 gave traders the go-ahead to push higher once again - and buyers entered on queue.
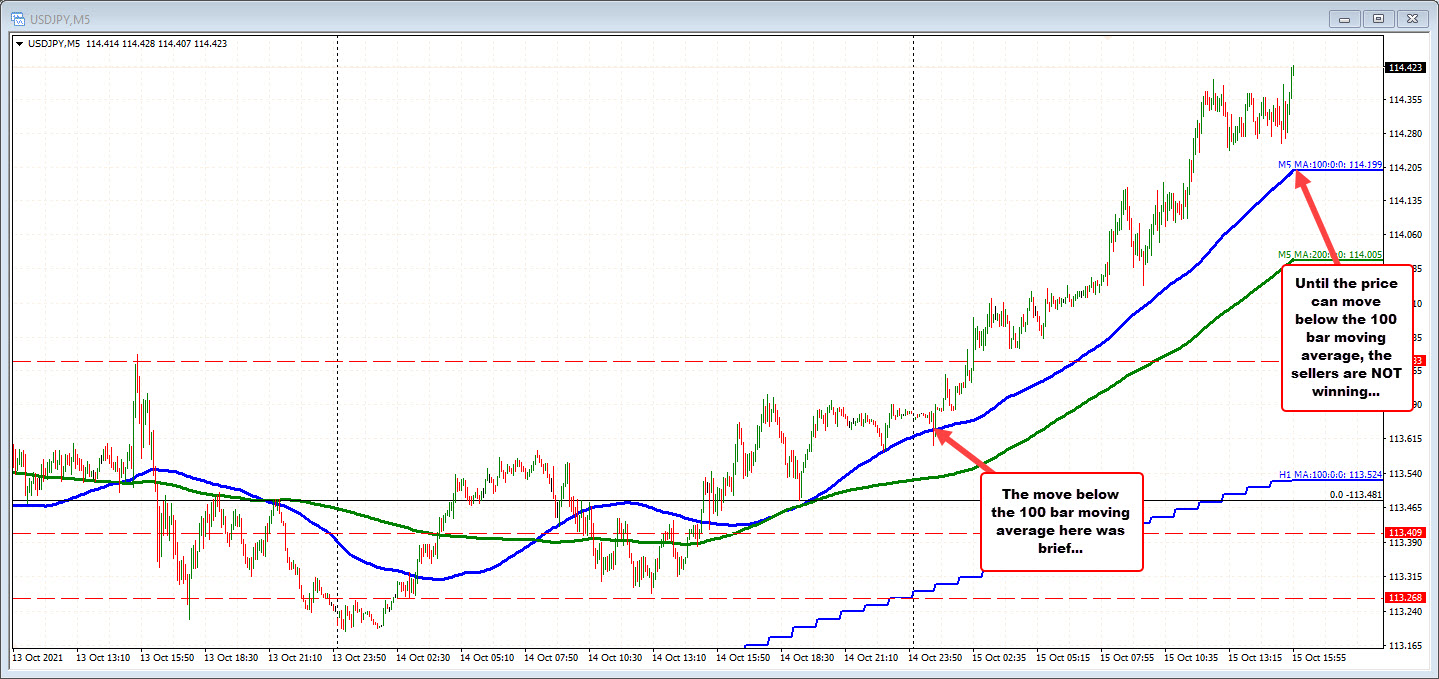
Drilling to the five minute chart, the rising 100 bar moving average at 114.199 is close intraday risk now. Apart from a brief five or so minute dip below the moving average in the early Asian session, the price has remained above that moving average as the pair trends higher and higher.
It would take a move below that 100 moving average to hurt the intraday technical bias, and give sellers some hope. Until then, however, the sellers are NOT winning. The buyers ARE winning.
Higher US yields and stocks are helping that trend. The cross currency pairs are also on fire.
- Dow up 232 points. S&P up 21 points. NASDAQ up 47 points in premarket trading
- 10 year up 3.7 basis points at 1.556%. Five year up 4.8 basis points at 1.0977%.

