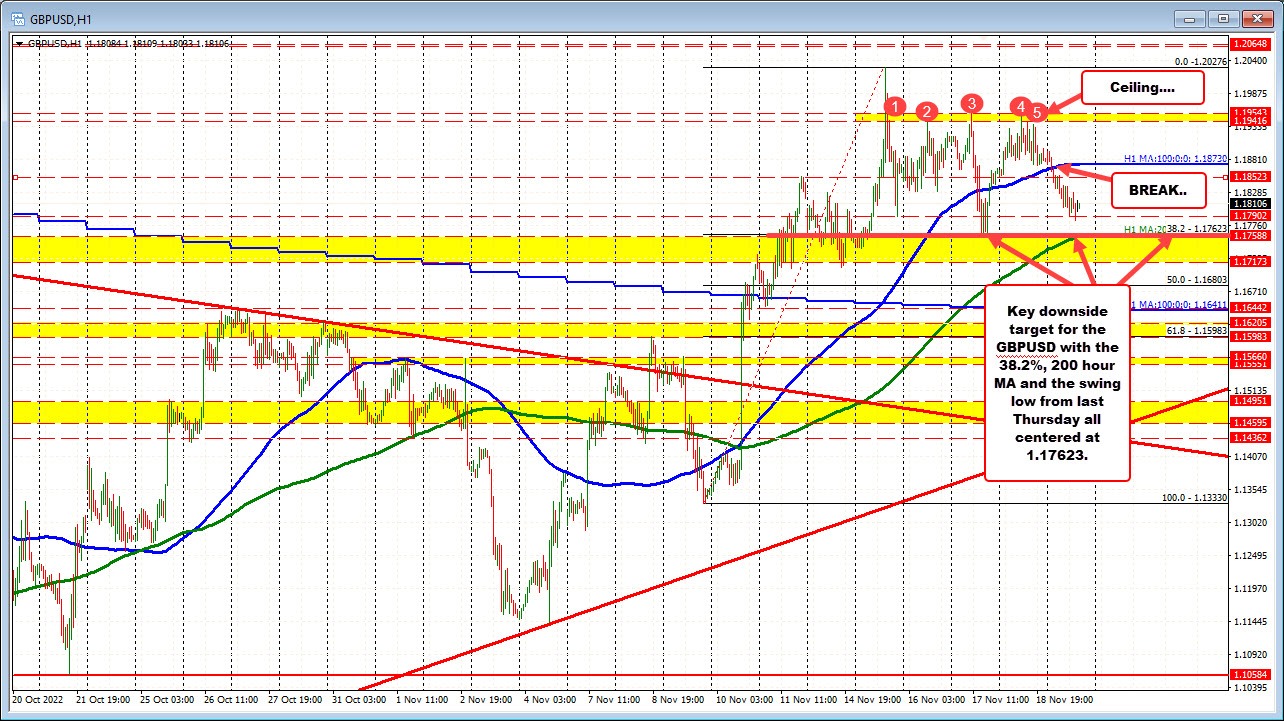
Early in the Asian session today, the GBPUSD fell back below its rising 100 hour moving average currently at 1.1873 (blue line in the chart above).
The break, tilted the bias back to the downside and in turn shifted the buyers to sellers after the up and down trading week last week. Recall, the price high on Tuesday saw the price move above the 1.2000 level to a high of 1.20276, but momentum could not be sustained, and the subsequent high prices on Wednesday, Thursday, and Friday all STALLED well below the 1.2000 level and stalled between 1.19416 and 1.19543.
Today, the break back below the 100 hour moving average today as traders now eyeing the 200 hour moving average and 30.2% retracement of the last move higher from the November 9 low. Those levels come in at 1.17623. The low price from Thursday's trade was also right at that level increasing the levels importance from a technical perspective. There should be support buyers/profit takers near that level with selling on a break with momentum.
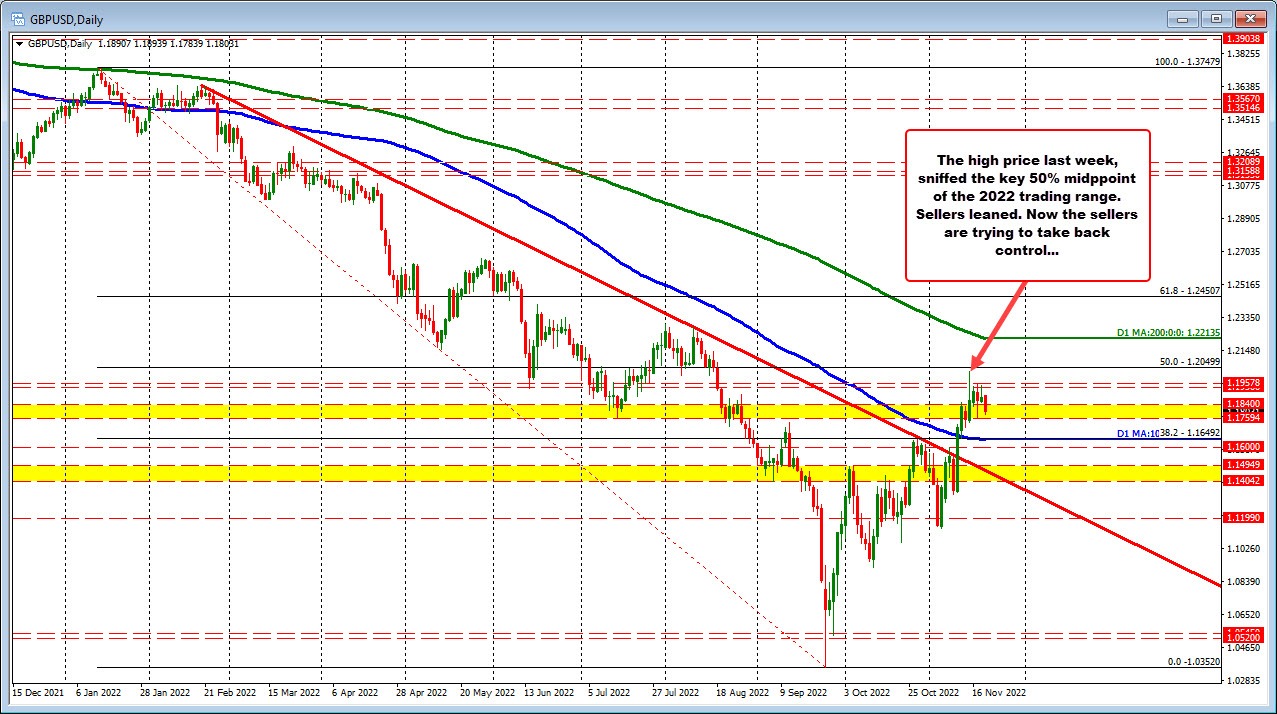
In the short term, the sellers are making a play after a key resistance target at the 50% of the 2022 trading range at 1.20499 was sniffed last week (see daily chart below).The high price last week reached 1.2028. Early sellers leaned against that key upside retracement target on the first look.

So, after the high was set, falling below the 100 hour MA is step one. Getting below the 200 hour MA and 38.2% at 1.1762 would be the next step on a corrective move. Below that the 50% of the last leg higher at 1.16803 would be targeted. The 100 day MA at 1.16492 would follow.
Those levels represent the minimum targets if the sellers are to take back more control. Absent that, and with a move back above the 100 hour MA at 1.1873, and the move down is simply a minor correction in a stronger rebound to the upside in this pair, with the 50% of the 2022, the key technical target to get to and through on the topside.


